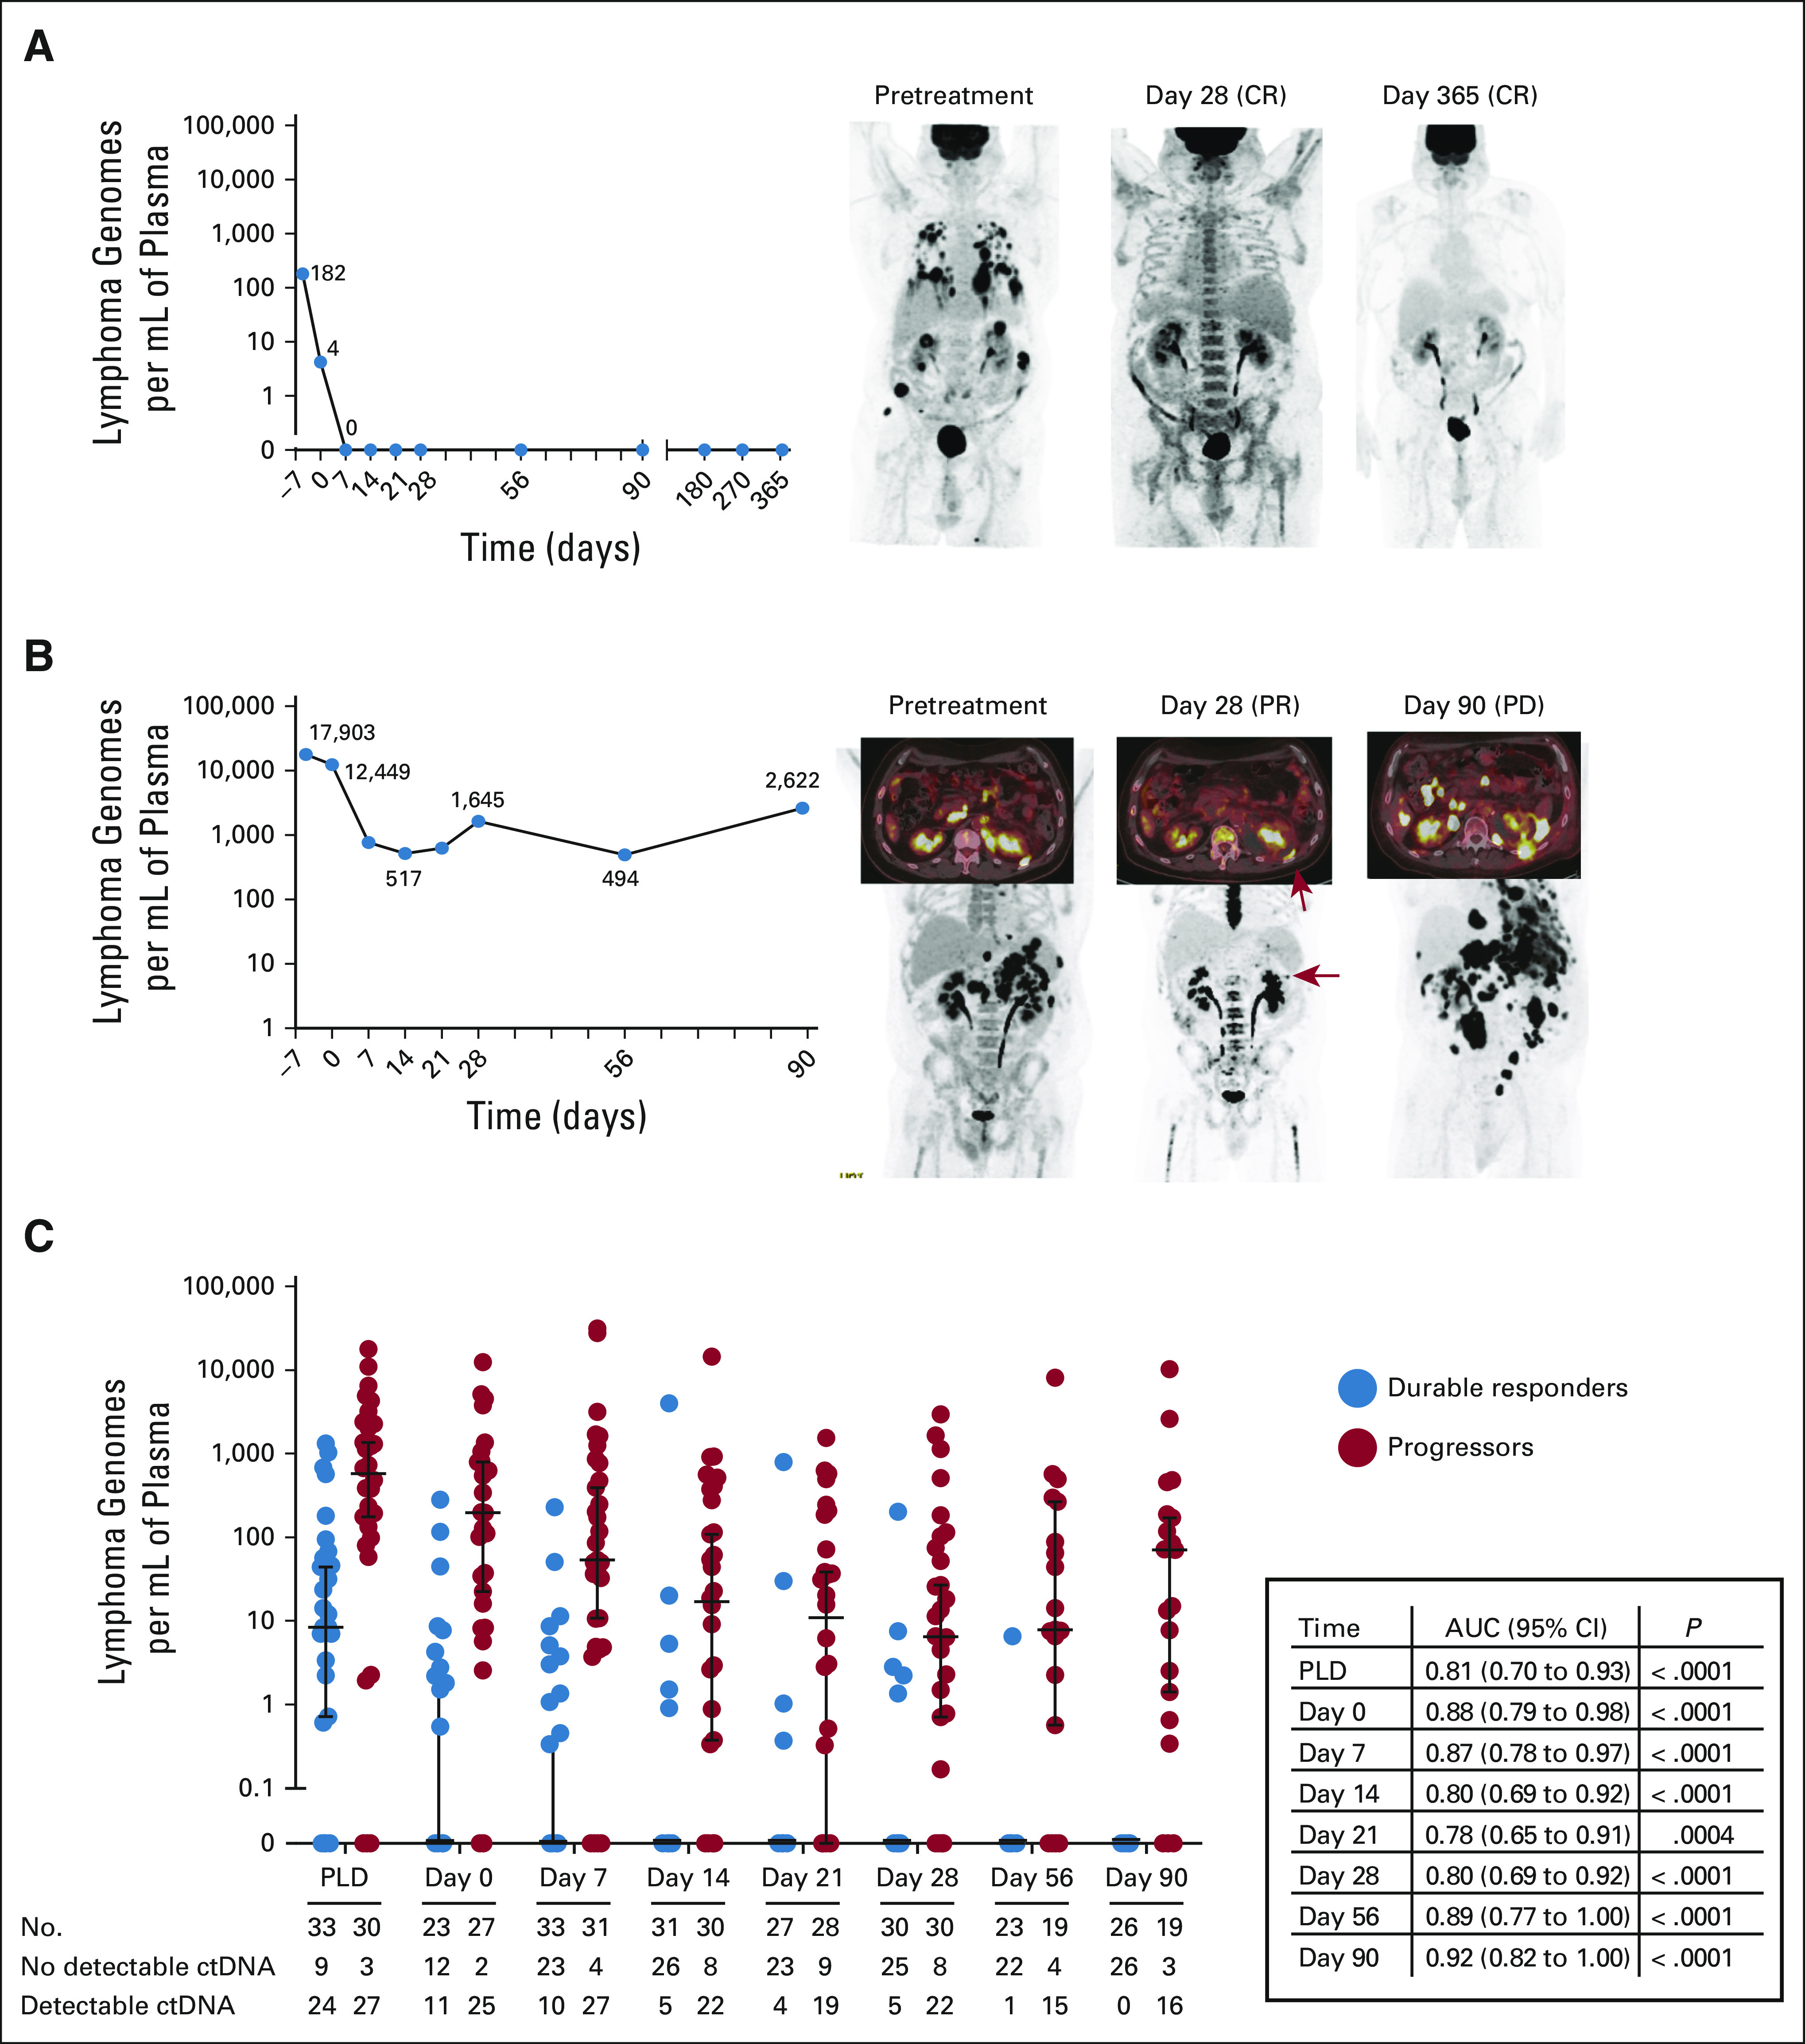
FIG 1.

ctDNA dynamics during axi-cel therapy. The patient shown in (A) demonstrated a durable CR and no detectable ctDNA starting from day 7 after axi-cel infusion. By contrast, the patient in (B) demonstrated a PR as shown by PET-CT on day 28 after axi-cel infusion, followed by PD as shown on the PET-CT scan on day 90. The patient has persistently detectable ctDNA after axi-cel infusion. (C) The concentration of ctDNA of durably responding (blue) and progressing (red) patients is shown at each time point starting from PLD until day 90. The median concentration of ctDNA (black horizontal bar) and 95% CI are shown. The number of samples available and whether there is detectable or no detectable ctDNA are shown below. The AUC with the 95% CI and P value is shown for each time point. The four patients who relapsed on day 28 were excluded at the day 56 and day 90 time points. AUC, area under the receiver operating characteristic curve; axi-cel, axicabtagene ciloleucel; CR, complete response; ctDNA, circulating tumor DNA; PD, progressive disease; PET-CT, positron emission tomography-computed tomography; PLD, prelymphodepletion; PR, partial response.
