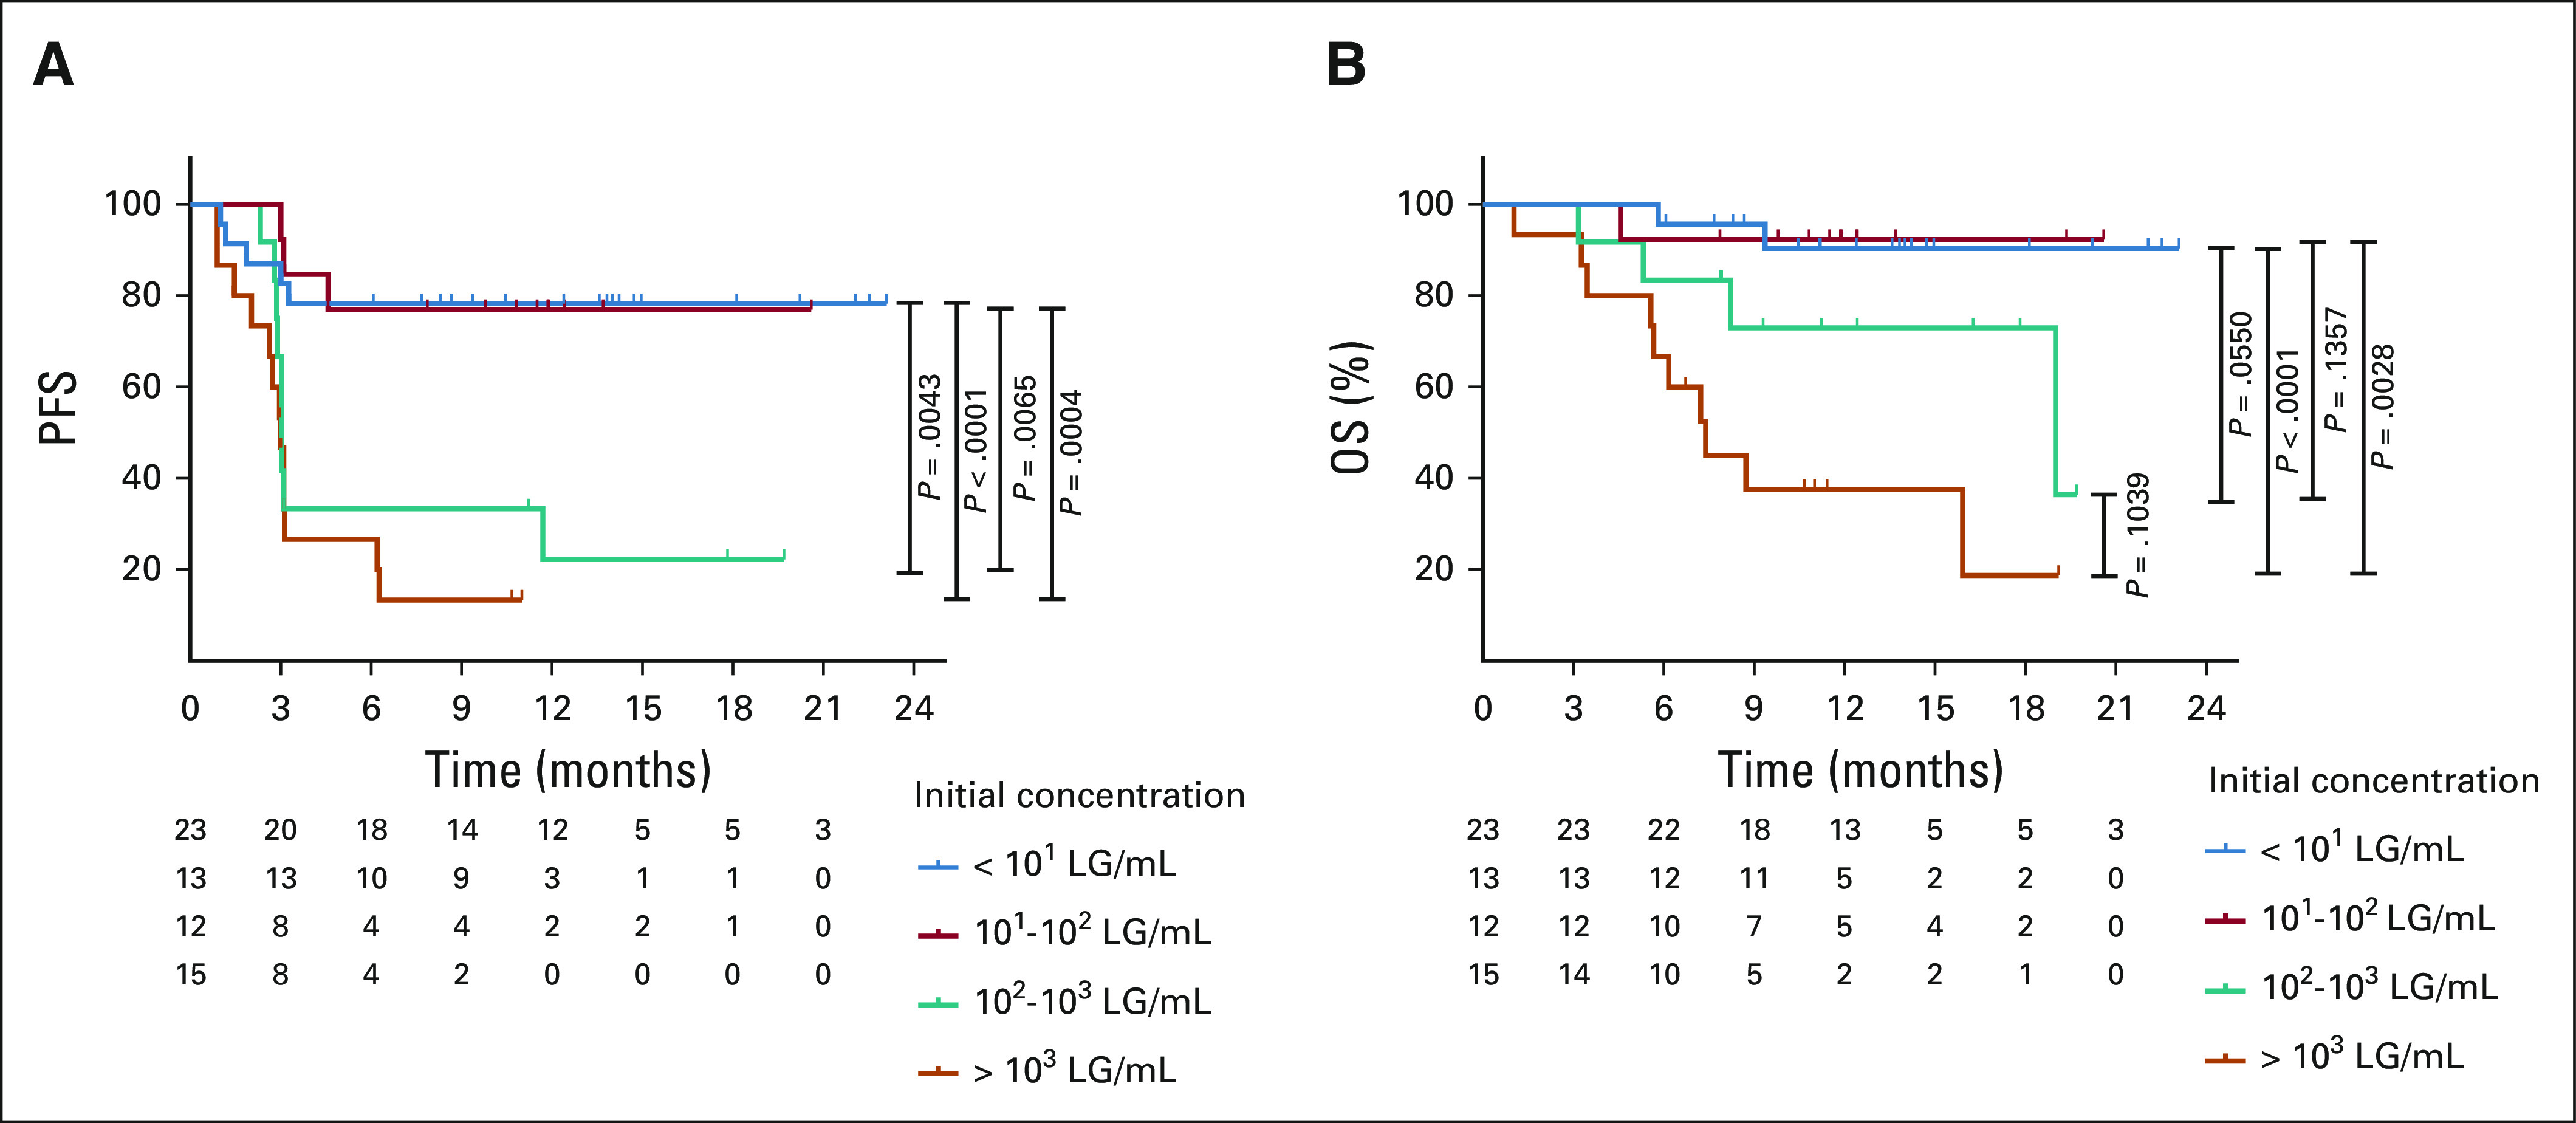
FIG 2.

Clinical outcomes by initial ctDNA concentration. The (A) PFS and (B) OS are shown by initial ctDNA concentration from below 10 (blue), between 10 and 100 (red), between 100 and 1,000 (green), and more than 1,000 (orange) LG/mL. ctDNA, circulating tumor DNA; LG/mL, lymphoma genomes per mL of plasma; OS, overall survival; PFS, progression-free survival.
