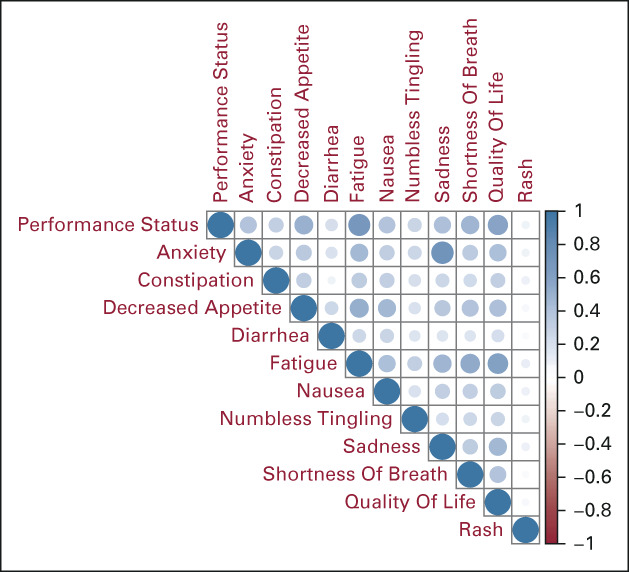
FIG 1.

The correlations between the PROs in the data set. Darker and larger dots indicate stronger correlations. For example, the correlation between decreased performance status and fatigue was 0.69, while the correlation between anxiety and sadness was 0.72. PRO, patient-reported outcome.
