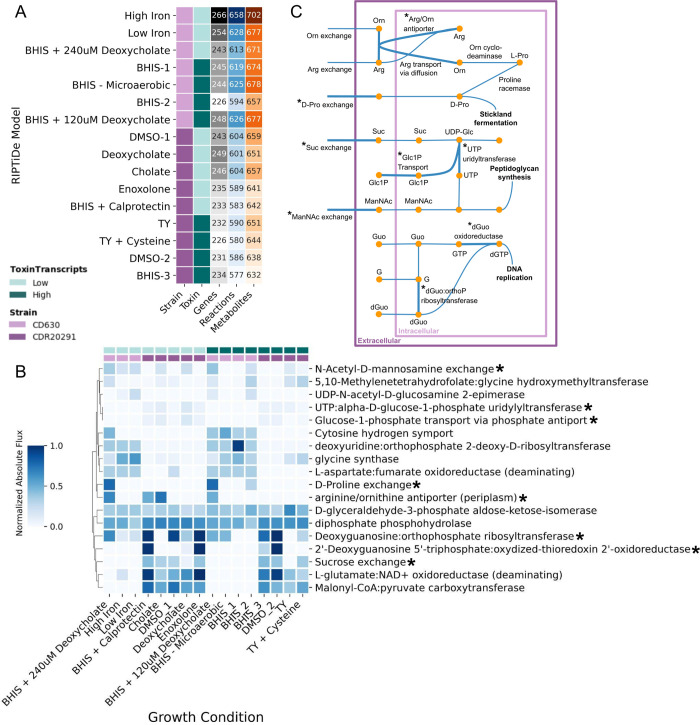
Fig 2. Metabolic differences between toxin states are strain-specific.
(A) Summary table of the RIPTiDe contextualized models including the strain, toxin production level, and number of genes, reactions, and metabolites. (B) Normalized, absolute flux values for reactions indicated by Random Forest classifier as important for distinguishing between toxin levels. C. difficile strains 630 and R20291 are shown by light and dark purple respectively. Toxin transcript levels are shown by light (low) and dark (high) teal. Starred reactions are contextualized in panel (C). (C) Map of reactions in the metabolic model. Reactions identified by Random Forest analysis in panel (B) are starred. Arg: Arginine, Orn: Ornithine, Pro: Proline, Suc: Sucrose, UDP-Glc: UDP-Glucose, Glc1P: Glucose-1-phospate, ManNAc: N-acetyl-D-mannosamine, Guo: Guanosine, dGuo: Deoxyguanosine, G: Guanine.

