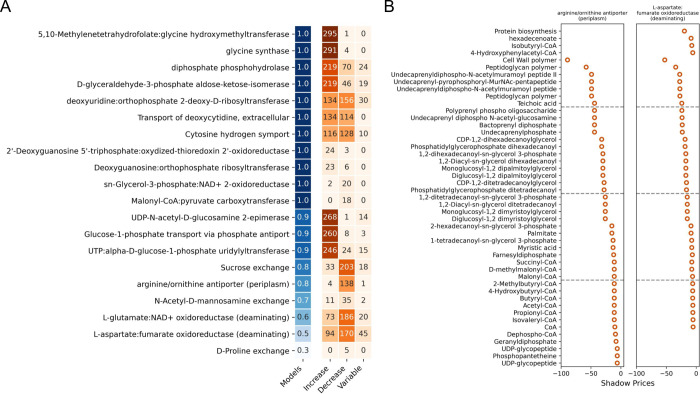
Fig 3. Flux through arginine and ornithine reactions is sensitive to intracellular metabolite concentrations.
(A) Summary of the shadow pricing analysis with the top 20 reactions from the Random Forest classifier set as the objective function. The number in the "models" column (blue) corresponds to the fraction of contextualized models that were able to carry flux with the indicated reaction set as the objective function (OF). The values in the orange columns indicate the following: Increase: the number of metabolites for which an increased level results in increased flux through the OF (median shadow price > 0, range < 2); Decrease: the number of metabolites for which an increased level results in decreased flux through the OF (median shadow price < -0.1, range < 2); and Variable: the number of metabolites whose shadow price varied across RIPTiDe models (range > 2). For example, in the first row of panel (A), the OF was able to carry flux in all of the models, 294 metabolites increased flux through the OF in all of the models, 1 metabolite limited flux through the OF in all of the models, and 5 metabolites had different effects on flux through the OF across all of the models. (B) Shadow prices for limiting metabolites in arginine/ornithine and aspartate metabolism reactions. The metabolites categorized as sensitive in panel (A) for these OFs and with a shadow price < -5 are shown. Increasing negative values indicates increasing reaction flux sensitivity to the metabolite.

