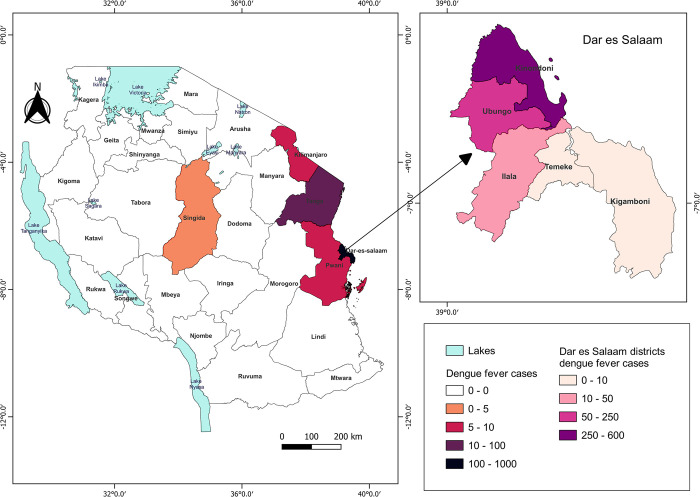
Fig 1. Distribution of dengue fever cases in Tanzania from 2017 to 2019.
The map shows 26 Tanzania mainland administrative regions. The five color-coded regions show dengue fever cases distribution between 2017–2019. Map created with QGIS 3.24.1 All shape files are openly available sources (https://www.nbs.go.tz/index.php/en/census-surveys/gis/385-2012-phc-shapefiles-level-one-and-two). The shapefiles were made based on the 2012 population and housing census, but in this study, the shapefile has been modified to capture all the regions and district information.

