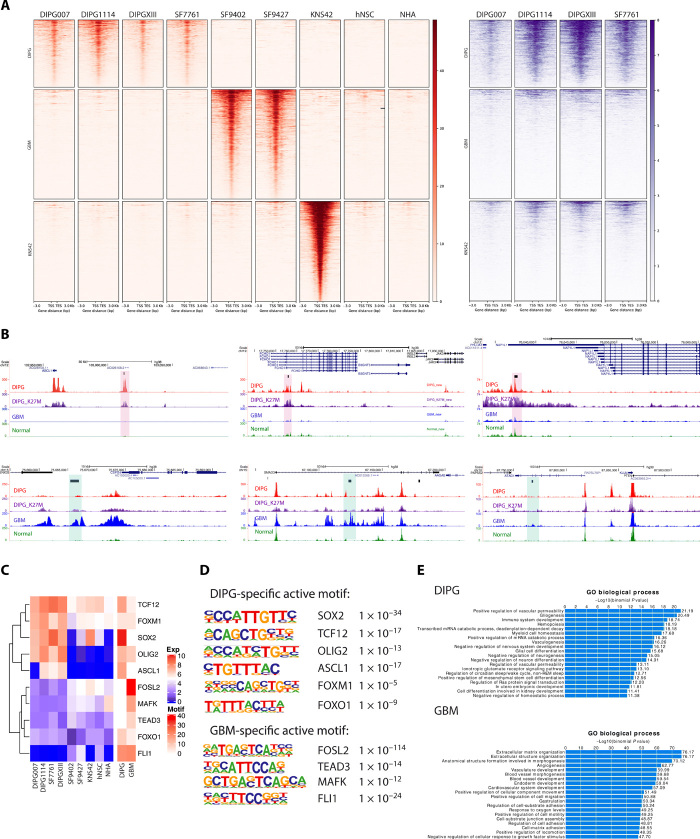
Fig. 2. ChIP-seq data revealed tumor-specific enhancer landscapes that result in specific motif and TF enrichment.
(A) H3K27ac ChIP-seq reveals tumor-specific distal enhancers (red). DIPG-, GBM-, and G34V-specific distal enhancers are shown, with normal cell lines as controls. H3.3K27M signals were shown for DIPG cell lines at the same regions of H3K27ac (purple). The GBM cell line KNS42 (H3G34V mutant) is excluded from subsequent motif enrichment analysis due to its distinct molecular profile relative to the H3 wild-type GBM cell lines (n = 2). (B) Representative genome browser view of DIPG- and GBM-specific enhancers. Tracks are superimposed H3K27ac and H3.3K27M ChIP-seq tracks from DIPG (n = 4), GBM (n = 2), and normal (n = 2) cell lines. Tumor-type specific enhancer peak calls are represented as black bars above tracks. DIPG-specific enhancers are highlighted in red and GBM-specific enhancers in blue. (C) Motif enrichment with differentially expressed genes between DIPG and GBM cell lines. Expression levels of the motif genes are shown (left); heatmap shows the motif enrichment level (−log10 P value; right). Tumor-specific active motifs, defined as highly enriched motifs with high differential gene expression in a given tumor type, are shown (table, right). (D) TF motif enrichment is distinct in DIPG versus GBM cell lines. (E) GREAT analysis for DIPG- and GBM-specific distal enhancer regions TF motif enrichment implicates distinct biological processes in DIPG versus GBM.

