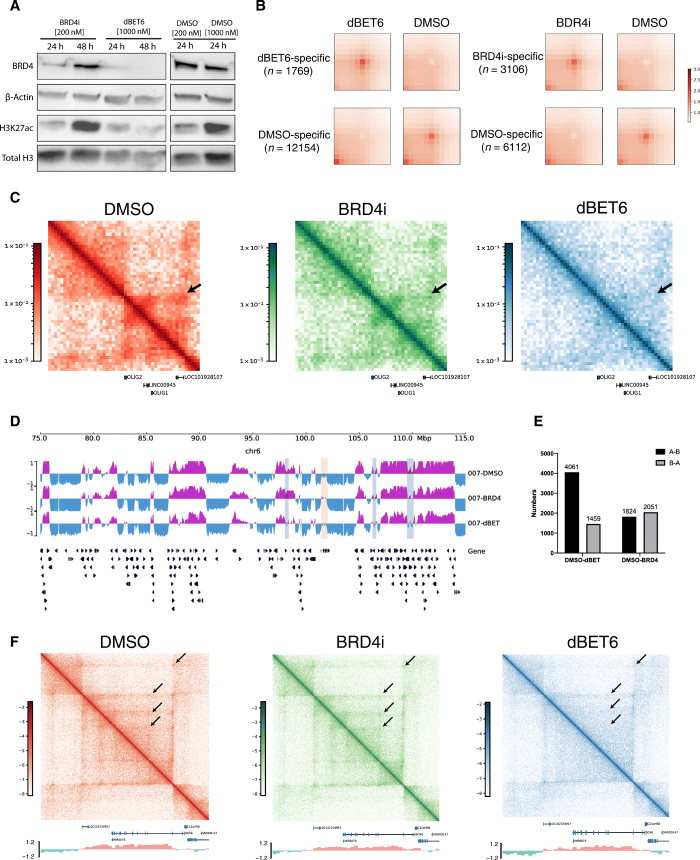
Fig. 4. Bromodomain-targeted treatment results in changes in DIPG 3D genome structure.
(A) Western blot analysis of BRD4i, β-actin, H3K27ac, and total H3 levels upon BRD4i or dBET6 treatment for 24 and 48 hours. The effect of both drugs on BRD4 levels was strongest at 24 hours, with greatest decrease after dBET6 treatment. (B) APA plot depicting aggregated signals from drug treatment–specific loops versus DMSO-specific loops (control). (C) Hi-C maps depicting genomic region chr21: 32,900,000 to 33,260,000, encompassing OLIG2, at 5-kb resolution in DMSO-, BRD4i-, and dBET6-treated cells. Tumor-specific `interaction (arrow) is disrupted 24 hours after BRD4i and dBET6 treatment, with dBET6 exerting a stronger effect. (D) A/B compartment designations at genomic region chr6: 75,000,000 to 115,000,000 at 40-kb resolution in DMSO-, BRD4i-, and dBET6-treated cells. A compartment, purple; B, blue. Regions of A to B switch between DMSO and drug treatments, light blue; regions of B to A switch, light yellow. Both A to B and B to A compartmental switches occur with drug treatment. (E) Number of genome-wide A/B compartment switches between DMSO and dBET6- or BRD4i-treated cells. A ➔ B and B ➔ A switches were observed with dBET6 and BRD4i treatment, compared to DMSO control. dBET6 exhibits a greater effect on compartmental switching. (F) Hi-C maps showing genomic region chr11: 15,200,000 to 17,000,000 bp, encompassing SOX6, at 5-kb resolution in DMSO-, BRD4i-, and dBET6-treated cells. A/B compartment signals are shown below Hi-C maps. Weakened interactions between the promoter region of SOX6 and surrounding regions are observed in dBET6-treated conditions, compared to DMSO control.

