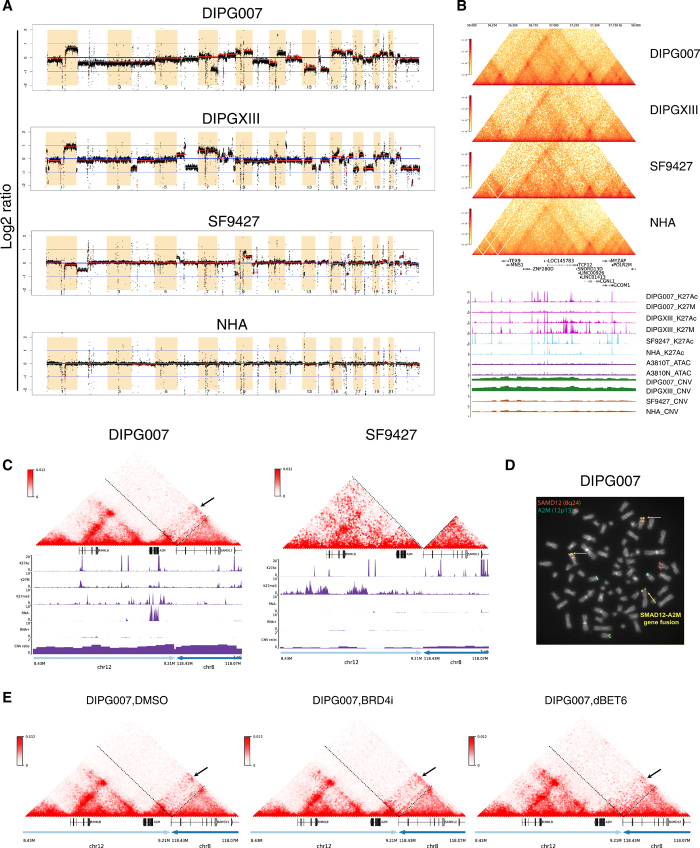
Fig. 5. SVs lead to enhancer hijacking and gene coamplification in DIPG.
(A) Genome-wide CNV profiles generated from Hi-C data using HiNT. Red lines, CNV segmentations for each cell line. Y axis, log2 copy number ratio. Greater CNVs are observed in glioma relative to normal cell lines, with the greatest number of CNVs identified in DIPGs. (B) Hi-C, H3K27ac, and H3K27M ChIP-seq; CNV; and ATAC-seq tracks at TCF12 (chr15: 56,000,000 to 58,000,000). In DIPG cell lines, coamplification is observed at TCF12 and the enhancer within the TCF12 intron region. Copy number gain is observed in DIPG but not GBM or normal cell lines, indicating that TCF12 up-regulation is due to both copy number gain and enhancer coamplification in DIPG. There is no difference in chromatin accessibility between DIPG and normal tissue at this region. (C) Enhancer hijacking events identified in DIPG007 based on SV analysis. Interchromosomal translocation is observed between chr12: 8,430,000 to 9,210,000 and chr8: 118,070,000 to 118,430,000. Copy number gain is also observed in this region, indicating simultaneous enhancer hijacking and coamplification upstream of the A2M gene. (D) Fluorescence in situ hybridization (FISH) using dual fusion translocation probes were hybridized to metaphases for detection of translocation t(8;12)(q24;p13) of SAMD12 and A2M genes. FISH analysis of the SAMD12 gene was identified by fluorescent spectrum orange signals and A2M gene by spectrum green signals. A fusion event was identified by fused orange and green signals = yellow arrows. Additional concurrent copy number gains of the SAMD12 and A2M loci were observed. (E) Hi-C maps after DMSO, BRD4i, and dBET6 treatment for the same translocation region as shown in (C).

