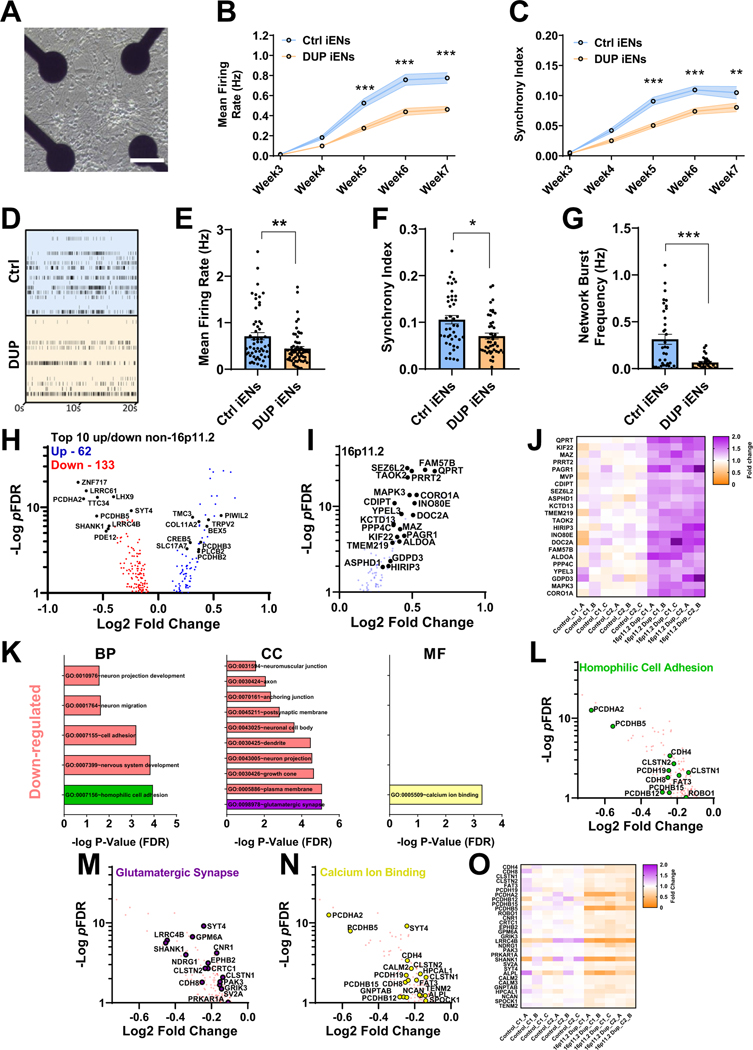
Figure 2.
Analysis of neuronal network activity and transcriptome of isogenic 16p11.2 duplication iEN monoculture. (A) Representative multielectrode array well of monocultured iENs. Scale bar = 50 μm. Developmental time course of iEN activity (B) and network synchrony (C). (D) Representative raster plot of iEN activity at 7 weeks in vitro. Well and plate averages of firing rate (E), synchrony index (F), and network burst frequency (G) at 7 weeks in vitro (N = 6, 2 clones from 3 independent differentiations, n = 30 wells per condition). (H) Volcano plot of DEGs identified in isogenic DUP lines (pFDR < .1, blue: upregulated, red: downregulated; 16,698 expressed with mean read counts > 5) with top 10 non-16p11.2 genes highlighted (black). (I) Volcano plot and (J) heatmap of 16p11.2 gene expression (fold change over mean control). C1_A indicates clone1, sample A, C1_B indicates clone1, sample B, etc. (K) Significantly enriched GO terms within DUP iENs. Volcano plot of top GO terms; homophilic cell adhesion, green (I), glutamatergic synapse, purple (M), and calcium ion binding, yellow (N) and heatmap of aggregated DEGs from these terms (O). *p < .05, **p < .01, ***p < .005. BP, biological process; CC, cellular component; Ctrl, control lines; DEGs, differentially expressed genes; DUP, 16p11.2 duplication; FDR, false discovery rate; GO, gene ontology; iENs, induced excitatory neurons; MF, molecular function.

