Figure 4.
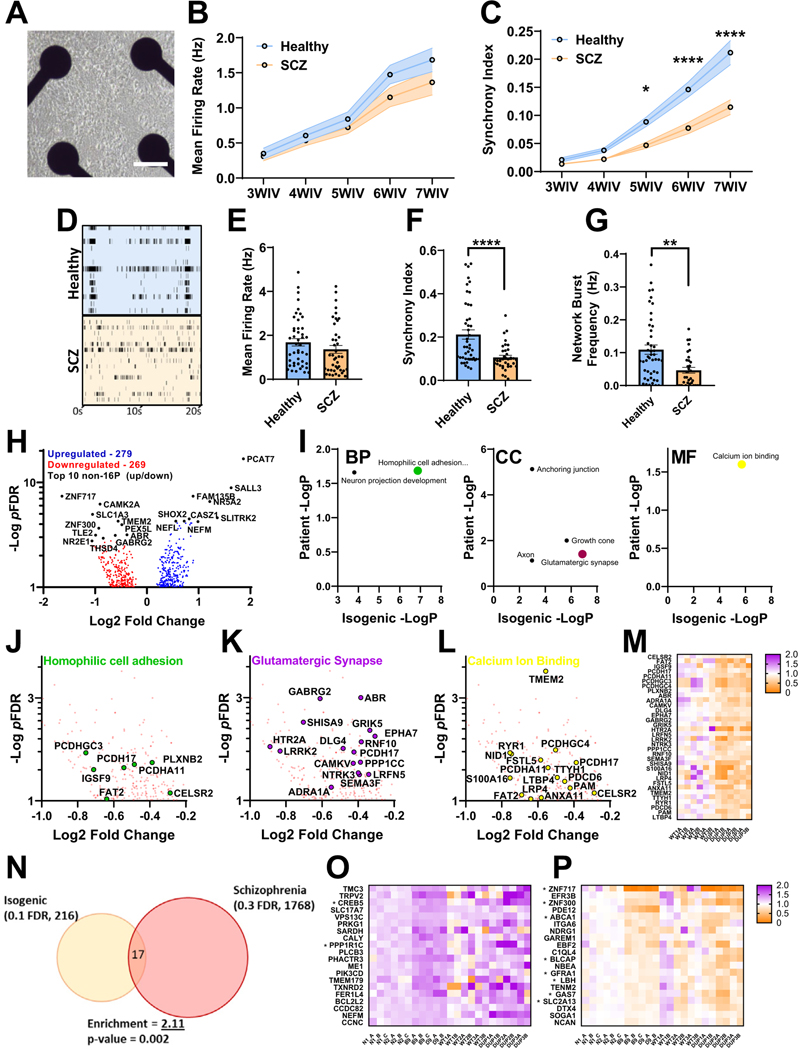
Analysis of neuronal network activity and transcriptome in SCZ patient–derived iENs. (A) Representative well of patient iENs on multielectrode arrays. (B) Developmental time course of healthy and SCZ-patient iEN mean firing rate. (C) Developmental time course of healthy and SCZ-patient iEN synchrony index. (D) Representative raster plot of healthy and SCZ-patient line activity. Well and plate averages of firing rate (E), synchrony index (F), and network burst frequency (G) at 7WIV (N = 6, 3 patients per condition from 2 independent differentiations, n = 30 wells per condition). (H) Volcano plot of dysregulated gene expression in patients with SCZ with top 10 DEGs highlighted (black, 14,315 expressed with mean read counts > 5). (I) Significantly enriched gene ontology terms within SCZ iENs overlapping with isogenic lines. Volcano plot of top overlapping gene ontology terms; homophilic cell adhesion (J), glutamatergic synapse (K), and calcium ion binding (L) and heatmap of aggregated DEGs from these terms (M). (N) Venn diagram of overlapping DEGs from isogenic (FDR ˂ 0.1) and patient (FDR ˂ 0.3) lines showing shared direction. An enrichment of 2.11, p = .002, was observed. (O) Heat plot of significantly upregulated (FDR < 0.1) isogenic DEGs with shared direction in patient lines. (P) Heat plot of significantly downregulated (FDR ˂ 0.1) isogenic DEGs with shared direction in patient lines. *p < .05, **p < .01, ****p < .001. BP, biological process; CC, cellular component; DEG, differentially expressed gene; FDR, false discovery rate; iENs, induced excitatory neurons; MF, molecular function; SCZ, schizophrenia; WIV, week in vitro.

