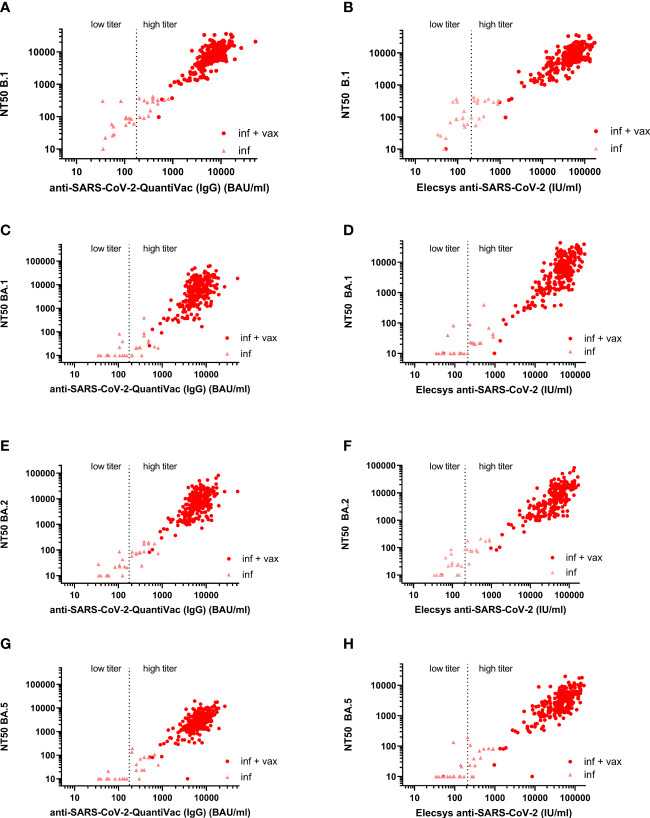
Figure 3.
Correlation between anti-S antibody concentrations and NT50 against B.1, BA.1, BA.2, and BA.5. (A) Correlation between anti-S antibody concentrations measured by anti-SARS-CoV-2-QuantiVac-ELISA (IgG) and NT50 against B.1 (Spearman correlation 0.78). (B) Correlation between anti-S antibody concentrations measured by Elecsys Anti-SARS-CoV-2 S and NT50 against B.1 (Spearman correlation 0.79). (C) Correlation between anti-S antibody concentrations measured by anti-SARS-CoV-2 QuantiVac-ELISA (IgG) and NT50 against BA.1 (Spearman correlation 0.66). (D) Correlation between anti-S antibody concentrations measured by Elecsys Anti-SARS-CoV-2 S and NT50 against BA.1 (Spearman correlation 0.77). (E) Correlation between anti-S antibody concentrations measured by anti-SARS-CoV-2-QuantiVac-ELISA (IgG) and NT50 against BA.2 (Spearman correlation 0.70). (F) Correlation between anti-S antibody concentrations measured by Elecsys Anti-SARS-CoV-2 S and NT50 against BA.2 (Spearman correlation 0.78). (G) Correlation between anti-S antibody concentrations measured by anti-SARS-CoV-2 QuantiVac-ELISA (IgG) and NT50 against BA.5 (Spearman correlation 0.72). (H) Correlation between anti-S antibody concentrations measured by Elecsys Anti-SARS-CoV-2 S and NT50 against BA.5 (Spearman correlation 0.76). Figures (A–H) Results of non-vaccinated convalescents (inf) are shown as triangles, and results of vaccinated convalescents (inf + vax) are shown as filled circles. The vertical dashed line at 176 BAU/ml for the anti-SARS-CoV-2 QuantiVac and at 210 U/ml for the Elecsys anti-SARS-CoV-2 represents the threshold above which CCP is considered high-titer CCP according to the FDA’s recommendations for investigational CCP (30).

