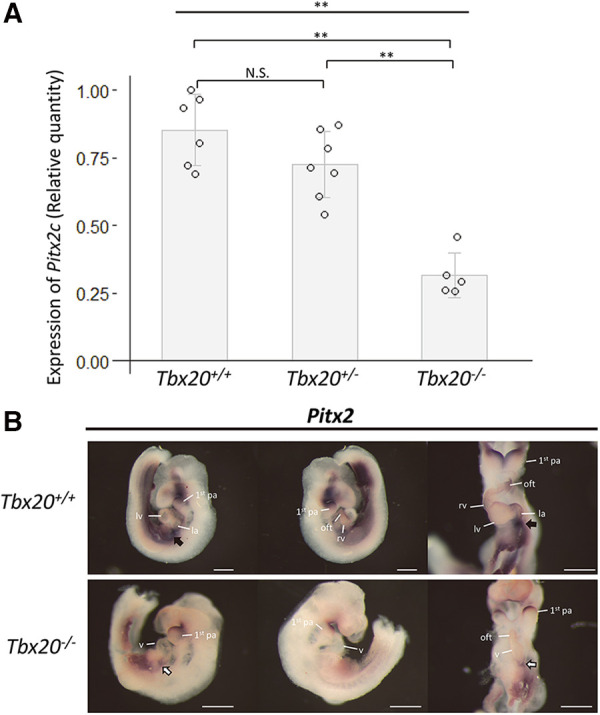
Figure 5.

Decreased expression of Pitx2 in TBX20 homozygous embryos. (A) Quantitative RT-PCR results show the significant decrease in Pitx2c expression in Tbx20−/− embryos, compared with that in Tbx20+/+ or Tbx20+/− at embryonic day 9.5. Gapdh was used as internal control. Data were analyzed using one-way ANOVA, followed by Tukey's post hoc test. **, p < 0.01; N.S., not significant. (B) Whole-mount in situ hybridization with Pitx2 antisense riboprobe. Pitx2 expression dramatically decreases in the area of the cardiac inflows of Tbx20−/− embryos (white arrows in the lower panels), compared to that of Tbx20+/+ (black arrows in the upper panels) at embryonic day 9.5. 1st pa; first pharyngeal arch; la, left atrium; lv, left ventricle; oft, outflow tract; rv, right ventricle; v, ventricle. Scale bars, 500 µm.
