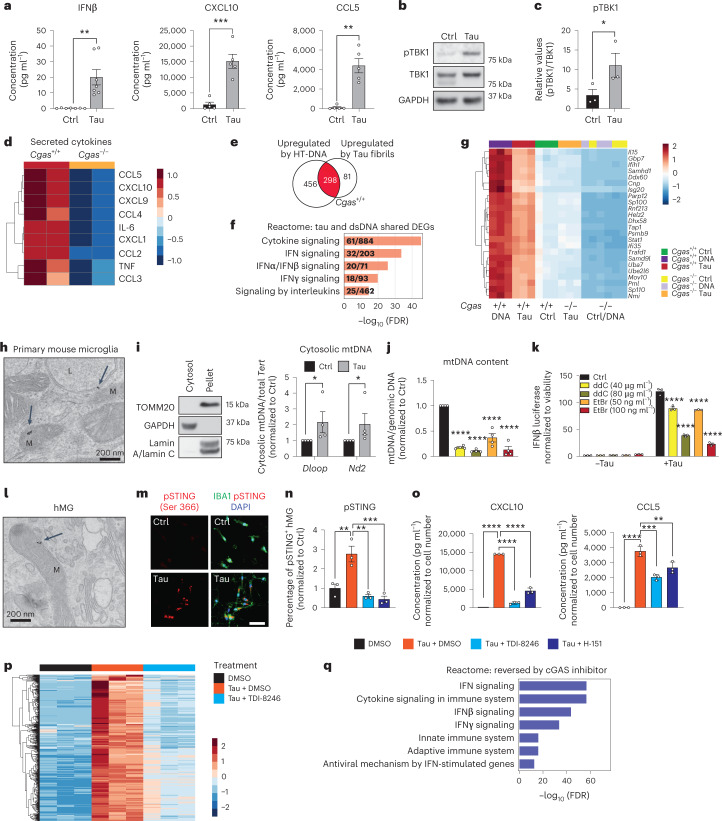
Fig. 2. Tau stimulation induces a cGAS-dependent IFN response that partially depends on mitochondrial DNA leakage.
a, Quantification of IFNβ expression by ELISA and CXCL10 and CCL5 expression by MAGPIX multiplex assay in culture medium supernatants from untreated (Ctrl) and tau-treated (Tau) primary mouse microglia. Data are reported as mean ± s.e.m. IFNβ: n = 7 independent primary microglial culture preparations treated with tau, **P = 0.0016; CXCL10 and CCL5: n = 5 independent primary microglial culture preparations treated with tau, ***P = 0.0004 and **P = 0.0031. Data were analyzed by two-tailed unpaired t-test. b, Representative western blots for pTBK1, total TBK1 and GAPDH using mouse primary microglial cell lysates (lane 1: untreated; lane 2: treated with tau fibrils). c, Ratio of pTBK1 to TBK1 from b showing significantly higher pTBK1 in tau fibril-treated primary microglia than in untreated microglia. Data are reported as mean ± s.e.m.; n = 3 independent primary microglial culture preparations treated with tau, *P = 0.0027. Data were analyzed by two-tailed unpaired t-test. d, Heat map showing the normalized levels of tau-induced cytokines in Cgas+/+ and Cgas−/− primary cultured microglia. e, Bulk RNA-seq analysis for Cgas+/+ and Cgas−/− primary cultured microglia treated or not treated with tau fibrils or HT-DNA; n = 3 per condition. Venn diagram showing the overlap of genes upregulated by HT-DNA and tau treatment in Cgas+/+ microglia; log2 FC > 1 and FDR < 0.05. f, Top five Reactome pathways represented in upregulated DEGs common to HT-DNA (dsDNA) and tau-treated Cgas+/+ microglia; FDR < 0.05. g, Heat map summary of IFN-stimulated genes that are lower in Cgas−/− than in Cgas+/+ microglia stimulated with HT-DNA or tau. h, Electron micrograph of primary mouse microglia treated with tau fibrils and immunogold labeled with an antibody to tau; L, lysosome; M, mitochondria. The experiment was performed once, and tau particles were detected in multiple mitochondria from different fields (arrows). i, Left, western blot showing the absence of mitochondrial and nuclear markers in the cytosolic fraction. Right, quantification of cytosolic mtDNA by quantitative PCR (qPCR; Dloop1/Tert and Nd2/Tert) in cytosolic extracts of BV2 IFNβ–luciferase reporter cells treated with tau fibrils or untreated. Data are reported as mean ± s.e.m.; n = 4 biologically independent experiments; *P = 0.0286. Data were analyzed by two-tailed Mann–Whitney test. j, Ratio of mtDNA (Dloop1) to genomic DNA (Tert) measured by RT–qPCR on DNA extracts of BV2 IFNβ–luciferase reporter cells treated for 7 d with ddC (40 or 80 μg ml–1) or EtBr (50 or 100 ng ml–1) to generate mtDNA-depleted cells. The values are normalized to the untreated sample. Data are reported as mean ± s.e.m.; n = 4; ****P < 0.0001. Data were analyzed by one-way analysis of variance (ANOVA) followed by Dunnett’s multiple comparison test. Groups are color coded as in k. k, Control and mtDNA-depleted IFNβ–luciferase reporter BV2 cells were stimulated with and without tau fibrils. IFNβ signal and viability were measured 16 h later. IFNβ–luciferase signal is normalized to CellTiter-Glo signal to correct for viability/cell count. Data are reported as mean ± s.e.m.; n = 3 biologically independent samples; ****P < 0.0001. Data were analyzed by two-way ANOVA followed by a Sidak multiple comparison test. l, Electron micrograph of human iPSC-derived microglia treated with tau fibrils and immunogold labeled with an antibody to tau; M, mitochondria. The experiment was performed once, and tau particles were detected in multiple mitochondria from different fields (arrow). m, Immunostaining for phosphorylated STING (pSTING; Ser 366) and IBA1 in human iPSC-derived microglia treated with tau fibrils for 6 h or untreated. n, Quantification of the percentage of pSTING+ cells in human iPSC-derived microglia treated with tau fibrils and DMSO, 20 µM TDI-8246 and 2 µM H-151 for 18 h; n = 3. Data are reported as mean ± s.e.m.; n = 3 biologically independent samples. DMSO versus Tau + DMSO, **P = 0.0044; Tau + DMSO versus Tau + TDI-8256, **P = 0.0012; Tau + DMSO versus Tau + H-151, ***P = 0.0007. Data were analyzed by one-way ANOVA followed by a Tukey multiple comparison test. o, Quantification of CXCL10 and CCL5 protein expression by MAGPIX multiplex assay in culture medium supernatants from human iPSC-derived microglia treated with tau fibrils and DMSO, 20 µM TDI-8246 and 5 µM H-151; n = 3; **P < 0.01, ***P < 0.001, ****P < 0.0001. Data were analyzed by one-way ANOVA followed by a Tukey multiple comparison test. p, Heat map showing the expression of tau-inducible genes reversed by treatment with 20 µM TDI-8246 (a cGAS inhibitor); log2 FC > 0.5 or < 0.5 and FDR < 0.05. q, Gene set enrichment analysis showing Reactome pathways associated with tau-induced genes that were reversed by treatment with 20 µM TDI-8246; log2 FC > 0.5 and FDR < 0.05.

