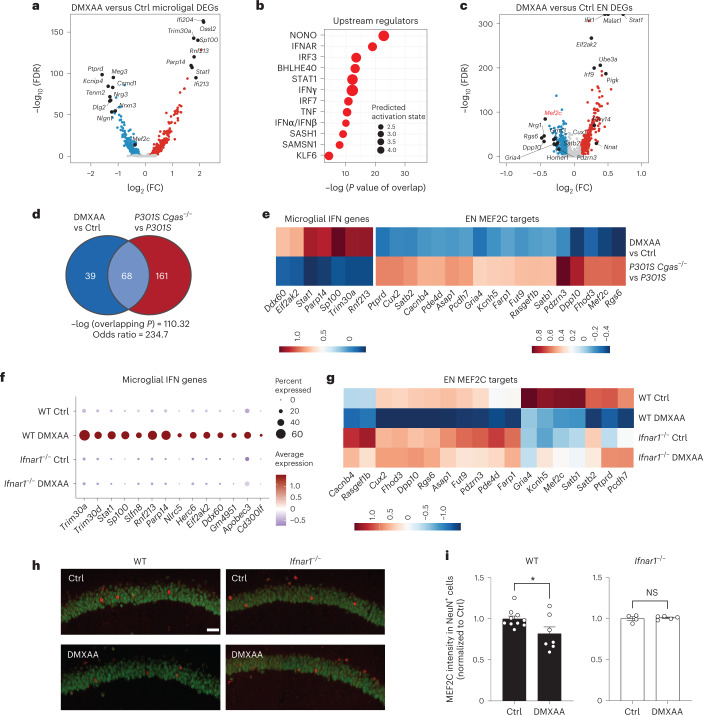
Fig. 6. STING activation elevates microglial IFN-I and diminishes the neuronal MEF2C transcription network.
a, Volcano plot showing representative DEGs in microglia of DMXAA-treated versus control WT mouse hippocampi; log2 FC of >0.1 or <−0.1 and FDR < 0.05. b, Ingenuity Pathway Upstream Regulator Analysis using DEGs from a. c, Volcano plot showing representative DEGs in ENs of DMXAA-treated versus control WT mouse hippocampi; log2 FC of >0.1 or <−0.1 and FDR < 0.05. d, Venn diagram showing the overlap of MEF2C target genes in DMXAA-treated versus control ENs and those in P301S Cgas–/– versus P301S ENs in the hippocampus. e, Heat map of log2 FC of overlapping differentially expressed MEF2C target genes in DMXAA-treated versus control WT and in P301S Cgas–/– versus P301S ENs in the hippocampus; scale, log2 FC. f, Dot plot showing microglial IFN gene expression in DMXAA-treated and control WT and Ifnar1−/− mouse hippocampi. g, Downregulation of MEF2C target genes in WT neurons treated with DMXAA was rescued in Ifnar1−/− neurons; scale, average gene expression. h, Representative ×25 confocal images of immunostaining of MEF2C and NeuN in the CA1 pyramidal layer of the mouse hippocampus in control and DMXAA-injected WT and Ifnar1−/− mice; scale bar, 50 μm. i, Mean intensity of MEF2C in MEF2C+NeuN+ neurons in the CA1 pyramidal layer. Each circle represents the average intensity measurement of three images per animal. Data are reported as mean ± s.e.m. WT: n = 10 control and n = 7 DMXAA; Ifnar1−/−: n = 4 control and n = 5 DMAXX; *P = 0.0367. Data were analyzed by two-tailed unpaired t-test.

