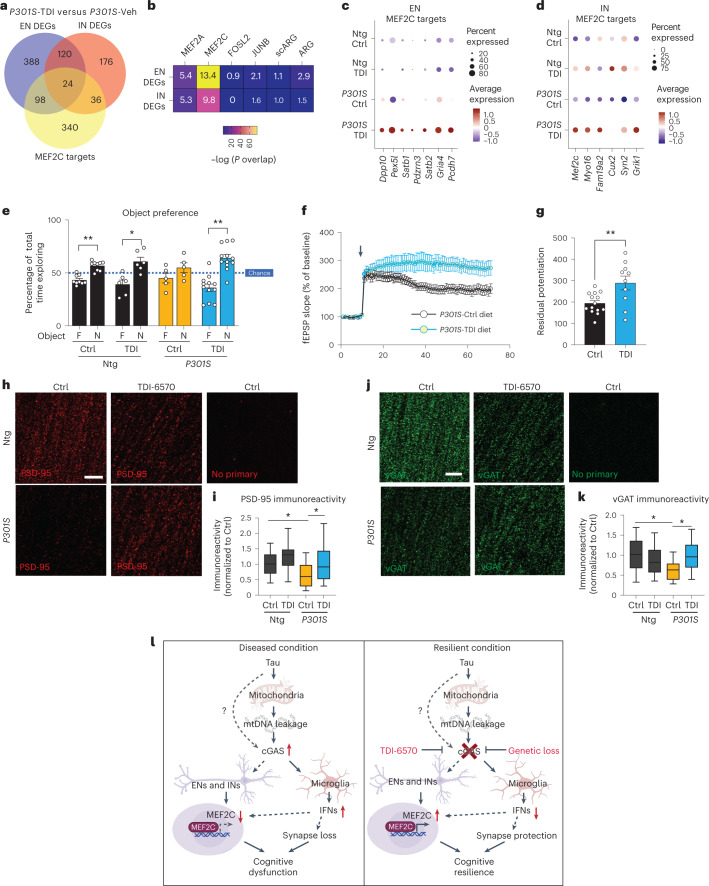
Fig. 7. A brain-permeable cGAS inhibitor enhances the MEF2C network and protects against synapse loss and cognitive deficits in mice with tauopathy.
a, Venn diagram of the overlaps in DEGs between P301S transgenic mice treated with TDI-6570 (P301S-TDI) and P301S transgenic mice treated with vehicle control (P301S-Veh) in ENs, INs and MEF2C target genes. b, Heat map showing the overlap between EN/IN DEGs and lists of TF target genes (MEF2A, MEF2C, FOSL2 and JUNB) and activity-induced DEGs (ARG and scARG). Numbers in each box represent the overlapping odds ratio. c, Dot plot showing the expression of significantly upregulated DEGs (FDR < 0.05, log2 FC ≥ 0.1) that are MEF2C targets in non-transgenic control (Ntg Ctrl), non-transgenic TDI-6570 (Ntg TDI), P301S transgenic control (P301S Ctrl) and P301S transgenic TDI-6570 (P301S TDI) EN clusters. d, Dot plot showing the expression of significantly upregulated DEGs (FDR < 0.05, log2 FC ≥ 0.1) that are MEF2C targets in non-transgenic control, non-transgenic TDI-6570, P301S transgenic control and P301S transgenic TDI-6570 IN clusters. e, Novel object recognition test for non-transgenic and P301S transgenic male mice fed 150 mg per kg (body weight) TDI-6570 or control diet for 3 months; F, familiar object; N, novel object. Data are reported as mean ± s.e.m.; n = 9 non-transgenic control, n = 6 non-transgenic TDI-6570, n = 5 P301S trasgenic control, n = 12 P301S transgenic TDI-6570. Non-transgenic control: **P = 0.00181; non-transgenic TDI-6570: *P = 0.0422; P301S transgenic TDI-6570: **P = 0.00167. Data were analyzed by two-tailed paired t-test for each condition. f, fEPSPs were recorded in the CA1 region, and a TBS protocol was applied (arrow) to the CA3 pathway to induce LTP. Data are reported as mean ± s.e.m. One to three slices per mouse were used; control, n = 13; TDI-6570, n = 9. g, LTP magnitude was calculated from the normalized mean fEPSP slope 50–60 min after TBS was applied. Data are reported as mean ± s.e.m.; one to three slices per mouse were used; n = 13 control; n = 9 TDI-6570; **P = 0.0058. Data were analyzed by two-tailed unpaired t-test. h, Representative confocal images of the hippocampal CA1 striatum radiatum labeled with PSD-95 antibody; scale bar, 10 μm. i, Mean intensity of PSD-95 puncta measured in the CA1 striatum radiatum. The center line is the median, box limits are the 25th to 75th percentiles, and whiskers are the minimum to maximum. Three to five images were taken per animal; n = 13 non-transgenic control, n = 12 non-transgenic, n = 9 TDI-6570, n = 12 P301S TDI-6570. Non-transgenic control versus P301S control: *P = 0.03, P301S control versus P301S TDI-6570: *P = 0.043. Data were analyzed by a two-way ANOVA mixed model. j, Representative confocal images of the hippocampal CA1 striatum radiatum labeled with vGAT antibody (scale bar = 10 μm). k, Mean intensity of vGAT puncta measured in the CA1 striatum radiatum. The center line is the median, box limits are the 25th to 75th percentiles, and whiskers are the minimum to maximum. Three to five images were taken per animal; n = 12 non-transgenic control, n = 11 non-transgenic TDI-6570, n = 8 P301S control, n = 13 P301S TDI-6570. Non-transgenic control versus P301S control: *P = 0.045, P301S control versus P301S TDI-6570: *P = 0.032. Data were analyzed by a two-way ANOVA mixed model. l, Working model illustrating the cGAS–IFN–MEF2C axis in tauopathy. In disease/vulnerable conditions, pathogenic tau activates the cGAS-dependent IFN response via mtDNA leakage in microglia and a reduction of the MEF2C transcriptional network in ENs and INs, resulting in cognitive dysfunction. Loss of cGAS reduces the IFN response in microglia and enhances the MEF2C transcriptional network, resulting in cognitive resilience.

