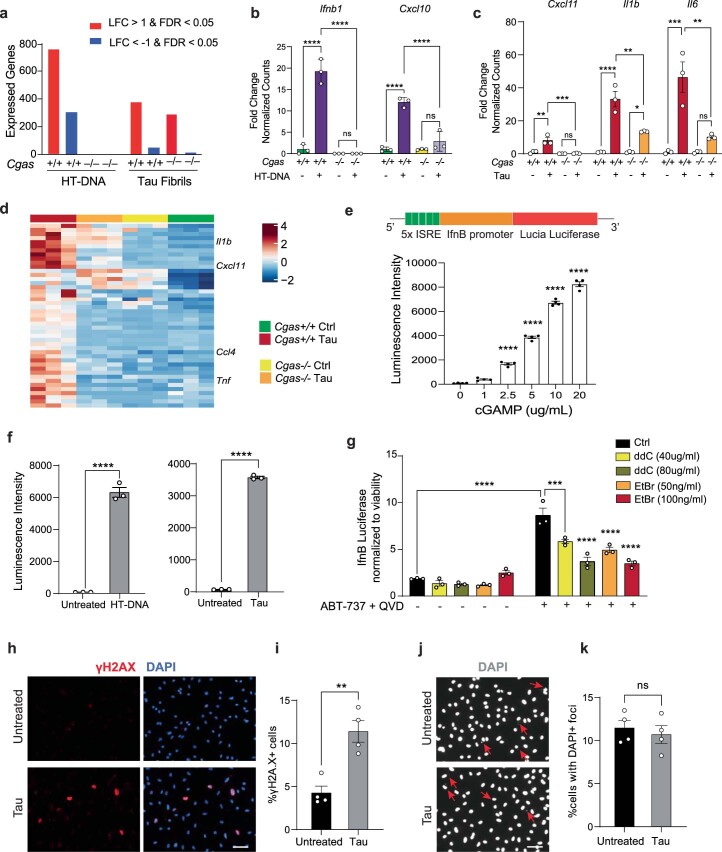
Extended Data Fig. 2. cGAS promotes IFN and proinflammatory cytokine signaling in tau-stimulated microglia (Related to Fig. 2).
a. Summary of DEGs identified using DESeq2 (|log fold-change| > 1 and FDR < 0.05), grouped by genotype and treatment. b. Bar plots showing normalized counts of diminished Ifnb1 and Cxcl10 induction in HT-DNA-treated Cgas−/− microglia. Data are reported as mean ± SD. n = 3 biologically independent samples. **** p < 0.0001. One-way ANOVA for each gene. c. Representative proinflammatory cytokine genes, Cxcl11, Il1b and Il6, that are significantly reduced in tau-stimulated Cgas-/-, compared to Cgas+/+ microglia. Data are reported as mean ± SEM. n = 3 biologically independent samples. Cxcl11: Cgas +/+ vs P301S Cgas +/+ ** p = 0.0018, P301S Cgas +/+ vs P301S Cgas−/− *** p = 0.0009,,. Il1b: Cgas +/+ vs P301S Cgas +/+ **** p < 0.0001, P301S Cgas +/+ vs P301S Cgas−/− ** p = 0.0016, Cgas−/− vs P301S Cgas−/− * p = 0.0241. Il6: Cgas +/+ vs P301S Cgas +/+ *** p = 0.0006, P301S Cgas +/+ vs P301S Cgas−/− ** p = 0.0028. One-way ANOVA followed by Tukey’s multiple comparisons test for each gene. d. Heatmap summary of genes with lower induction in tau-treated Cgas−/−, compared Cgas+/+ microglia. e. BV2 cells stably expressing IfnB-responsive luciferase reporter construct show dose-dependent increase of secreted luciferase activity in response to cGAMP. Data are reported as mean ± SEM. n = 4 biologically independent samples. Adjusted p-value <0.0001 for 0 vs 2.5, 0 vs 5, 0 vs 10, 0 vs 20. One-way ANOVA followed by Dunnett multiple comparison test. f. Quantification of luminescence intensity in BV2 IfnB luciferase reporter cells treated or not with HT-DNA or tau fibrils. Data are reported as mean ± SEM. n = 3 biologically independent samples. **** p < 0.0001. Two-tailed unpaired t-test. g. Control and mtDNA-depleted (ρ ͦ) IfnB luciferase-reporter BV2 cells were stimulated or not with ABT-737 + QVD (10 μm each). IfnB signal and viability were measured 18 h later. IfnB-luciferase signal is shown normalized to Cell TiterGlo signal to correct for viability/cell count. Data are reported as mean ± SEM. n = 3 biologically independent samples. *** p = 0.0004, **** p < 0.0001. Two-way ANOVA. h. Immunostaining for γH2A.X in primary cultured mouse microglia treated with tau fibrils. i. Quantification of the percentage of γH2A.X + cells in (h). Data are reported as mean ± SEM. n = 4 biologically independent samples. ** p < 0.0029. Two-tailed unpaired t-test. j. Visualization of extranuclear DNA foci indicated by arrows using DAPI staining. k. Quantification of the percentage of cells with extranuclear DNA foci in (j). Data are reported as mean ± SEM. n = 4 biologically independent samples. ns: not significant. Two-tailed unpaired t-test.

