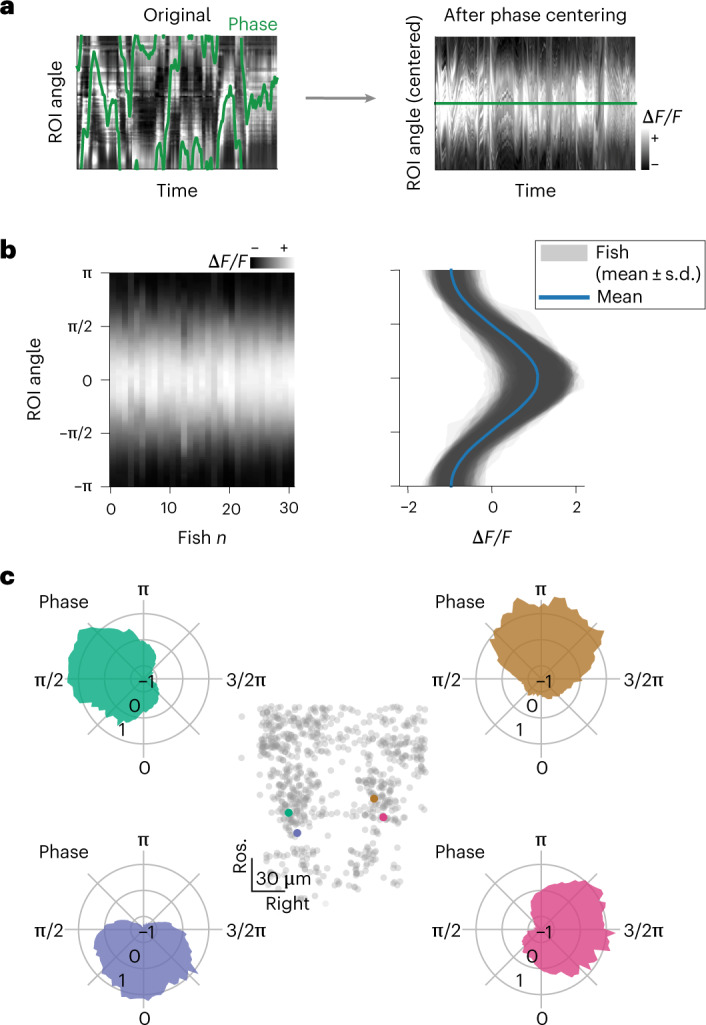
Fig. 2. Network activity profile.

a, Phase-zeroing process: for every time point, a circular permutation of the (interpolated) activity matrix was computed so that the peak of activation, mapped by the phase (left), was always in the center of the matrix. Right, the matrix of traces after the centering. b, Profile of the activity bump. Left, matrix showing the average activation profile for all fish in the dataset (n = 31 fish). Right, mean ± s.d. over time for each fish (shaded areas) and population average (blue). c, Polar plots showing tuning curves for the activation of individual neurons as a function of network phase from one fish. Each panel shows the curve for a neuron, color coded by their angle in rPC space θ. The anatomical locations of the four neurons are shown in the central inset.
