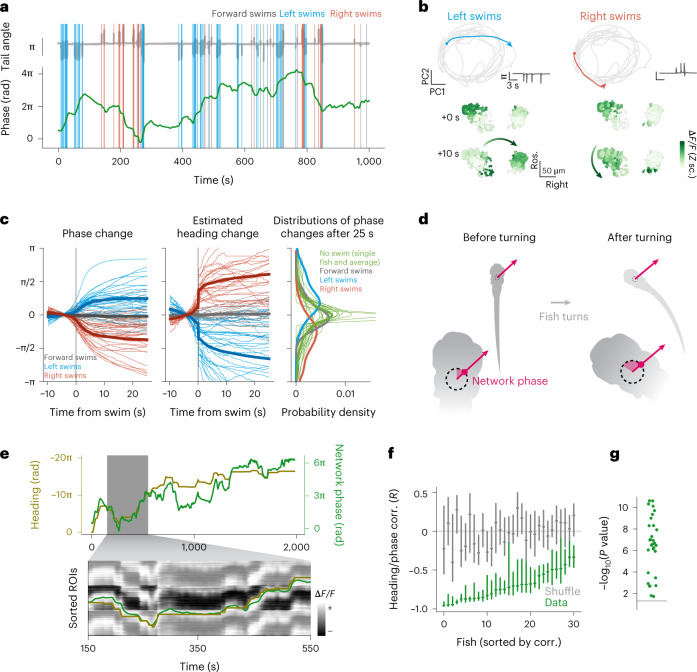
Fig. 3. The aHB network tracks estimated heading angle over many minutes.
a, Network phase and motor activity. Top, tail angle over time (gray). Colored vertical lines mark the occurrence and direction of swims. Bottom, unwrapped network phase (green) over time. b, Network trajectory during sequences of left and right swims. Top left, trajectory in phase space during a sequence of left swims (see tail angle in the inset on the right of each plot). Bottom left, state of activation of the network before and after the sequence. Right, a sequence of right swims. c, Left, swim-triggered average change in network phase for all fish (thin lines, n = 31 fish) and their overall average (thick lines). Center, swim-triggered change in estimated heading. Right, histograms of the accumulated phase change 25 s after a swim (blue, red and gray lines), together with fish-wise histograms of the spontaneous drift of the network phase in 25 s when no swim occurred (thin green lines, individual fish; thick line, average). d, Schematic to show how the network phase changes during a turn, and keeps pointing in the same direction in allocentric coordinates. e, Top, network phase (green) and estimated fish heading (gold) for the entire duration of an experiment. Note the axes are different and have opposite signs. The inset shows the same traces, overlaid on the traces from the r1π neurons, tiled to match the phase unwrapping. f, Correlation (corr.) of heading and network phase for all fish in 5-min chunks, compared with a shuffle of the same data. Bars report median and Q1 and Q3 for the data (green) and shuffle (gray). g, Distribution of P values for the comparison of correlation of phase and heading in the data and shuffle for each fish (Wilcoxon rank-sum test, P < 0.01 for n = 31 fish).

