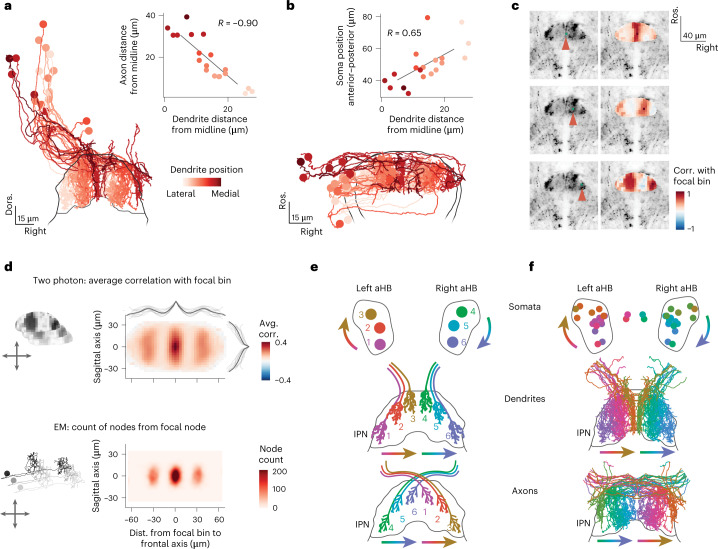
Fig. 6. Organization of dendrites and axons from the aHB within the dIPN.
a, Frontal view of the IPN-projecting aHB neurons, color coded by position of the dendrite on the coronal axis (lateral–medial). Inset, scatterplot of the distance from the midline of dendrite and axon for each neuron (R = −0.90, n = 19). b, Horizontal view of the IPN-projecting aHB neurons, color coded by position of the dendrite on the coronal axis (lateral–medial). Inset, scatterplot of the distance from the midline of dendrite and position of the soma of the anteroposterior axis for each neuron (R = 0.65, n = 19). c, Anatomy of Tg(gad1b:Gal4);Tg(UAS:GCaMP6s) from a two-photon experiment (left) with a focal bin highlighted by the red arrowhead, and maps of correlations (corr.) of bins with the focal bin (right). Each row corresponds to a different focal point. d, Top, average correlation of bins at different distances around a focal bin in the two-photon data. The lines on the side show the means of individual fish across each axis (thin lines) and the population average (thick line, n = 11). Bottom, counts of nodes around a focal node in the EM data. e, Schematics of the organization of aHB neuron somata (top) and their dendritic (middle) and axonal (bottom) projections in the IPN. f, Reconstructed EM neurons mirrored on both sides and color coded on the basis of the position of the dendrite, following the schema in e. Avg., average; Dist., distance.

