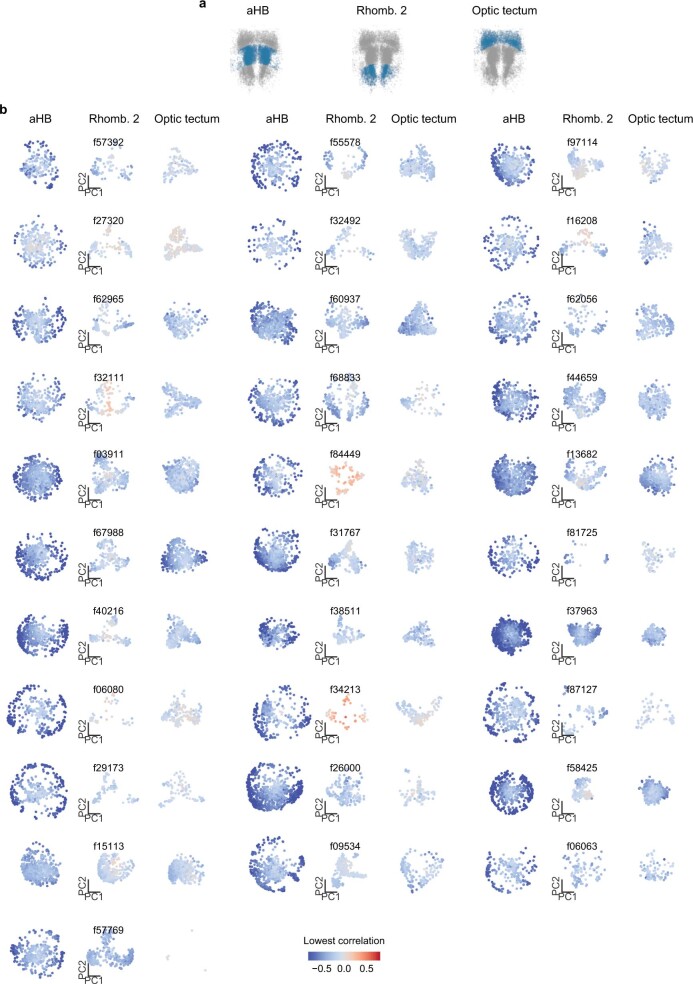
Extended Data Fig. 2. Circular distribution of PC projections is a feature of aHB.
a, ROIs coarsely grouped into anatomical regions using manually defined borders for optic tectum, anterior hindbrain and rhombomere 2. b, For every fish, principal components over time were computed over all neurons of each region, without any selection. Then, all ROIs were projected over the first two components. ROI are color coded by the maximum anticorrelation with any other cell in the dataset, the criterion that was used to define r1π neurons throughout the paper.

