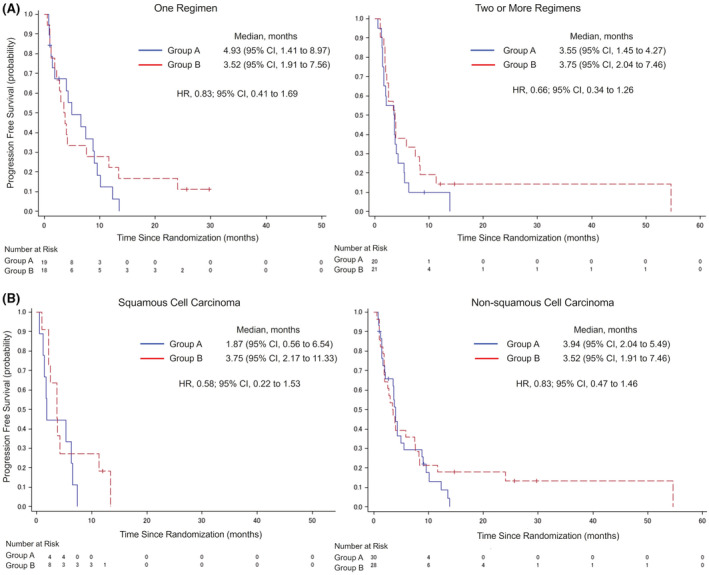
FIGURE 3.

Investigator‐assessed progression‐free survival by number of prior cytotoxic chemotherapies and investigator‐assessed progression‐free survival by histologic subtype of tumor. Kaplan–Meier plots for subgroup analysis of investigator‐assessed progression‐free survival (A) and overall survival (B) in the intention‐to‐treat (ITT) population. Stratification factors for overall survival were the number of prior cytotoxic chemotherapy regimens (1 or ≧2), tumor histology (squamous or nonsquamous). CI, confidence interval; HR, hazard ratio.
