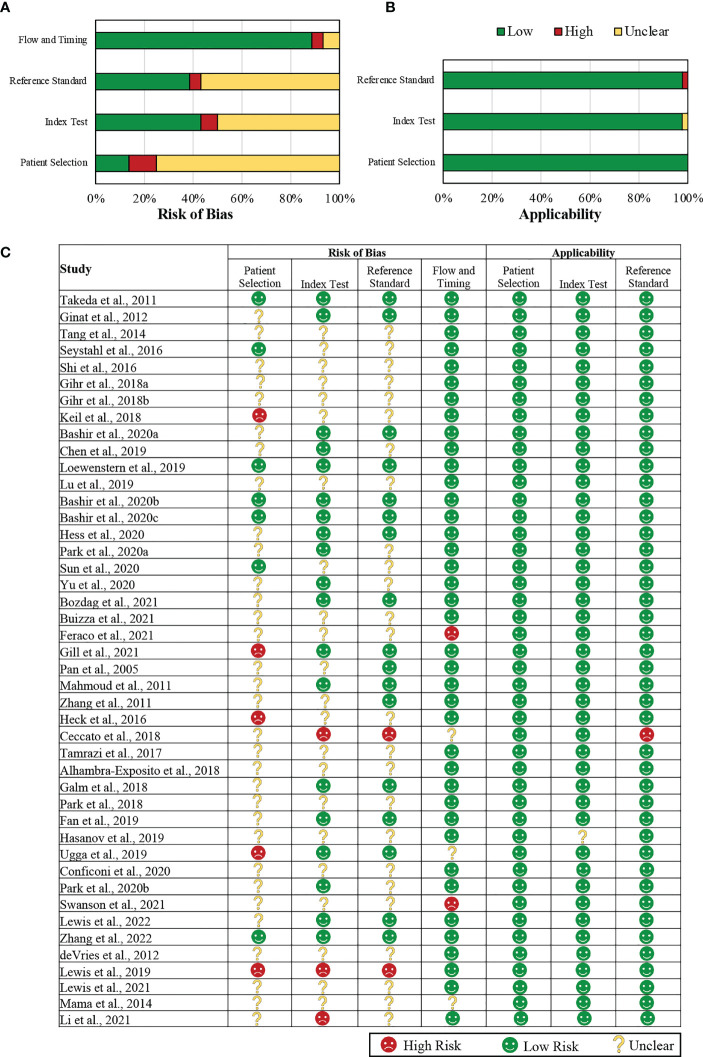
Figure 2.
Summary of the QUADAS-2 assessments of the included studies. (A) Graphical representation of included studies (in percentages) in each key domain in terms of the risk of bias. (B) A graphical representation of the included studies (in percentages) in each key domain in terms of the concerns regarding their applicability. (C) A tabular representation of the assessments assigned for each included study. QUADAS-2: Quality Assessment of Diagnostic Accuracy Studies-2.

