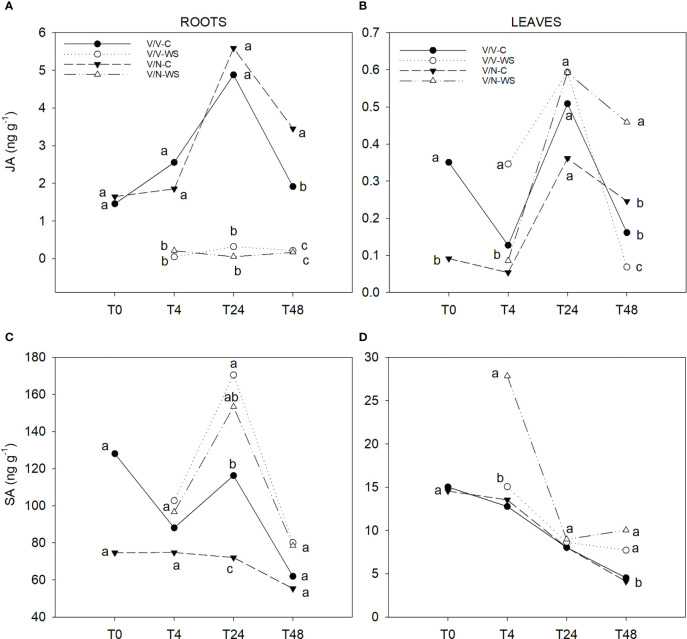
Figure 5.
JA (A, B) and SA (C, D) levels in roots and leaves of self-grafted pepper plants (V/V) and the plants grafted onto NIBER® (V/N) at 0% PEG (control, C) or 5% PEG (water stress, WS). Measurements were taken on T0, T4, T24 and T48 (hours after treatment with PEG began). Data are the mean values for n = 4. For each studied time, different letters indicate significant differences at P ≤ 0.05 (LSD test).

