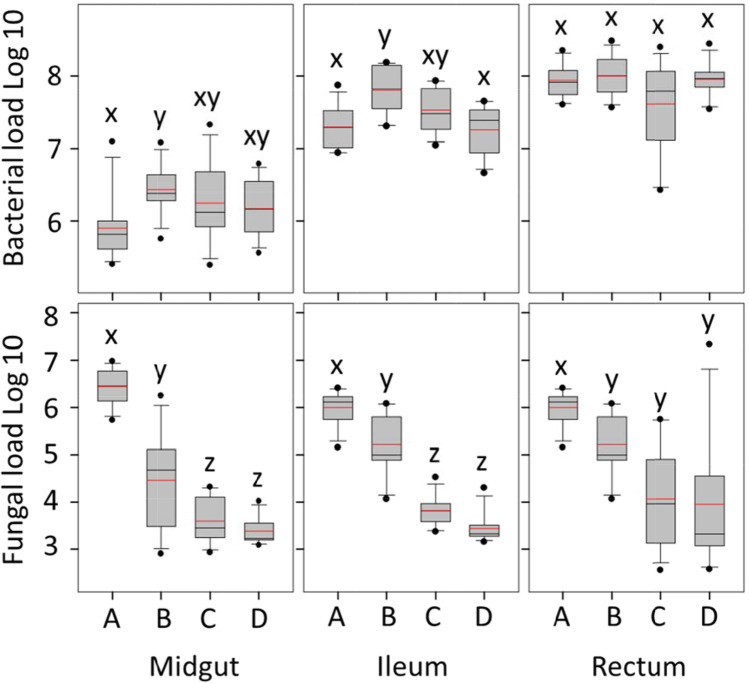
Fig. 2.
Bacterial and fungal load differ by social context and diet throughout the gut. On the x-axis, A is the positive control; large colonies exhibiting a typical age structure, and exposed to the pollination environment. Treatment B is fresh stored pollen (beebread), C is autoclaved corbicular pollen, and D is no pollen (negative control). Treatments B, C, and D lack the colony context, and each consist of three replicate cages containing 300 newly emerged bees and wax combs containing each diet treatment (Fig. 1). Y-axis values were determined by bactquant and fungiquant and are cell number for bacteria, rRNA copy number for fungi. Within each panel, distributions (boxplots) with the same lower case letter (x, y or z) do not differ significantly based on a Wilcoxon test (p < 0.05)

