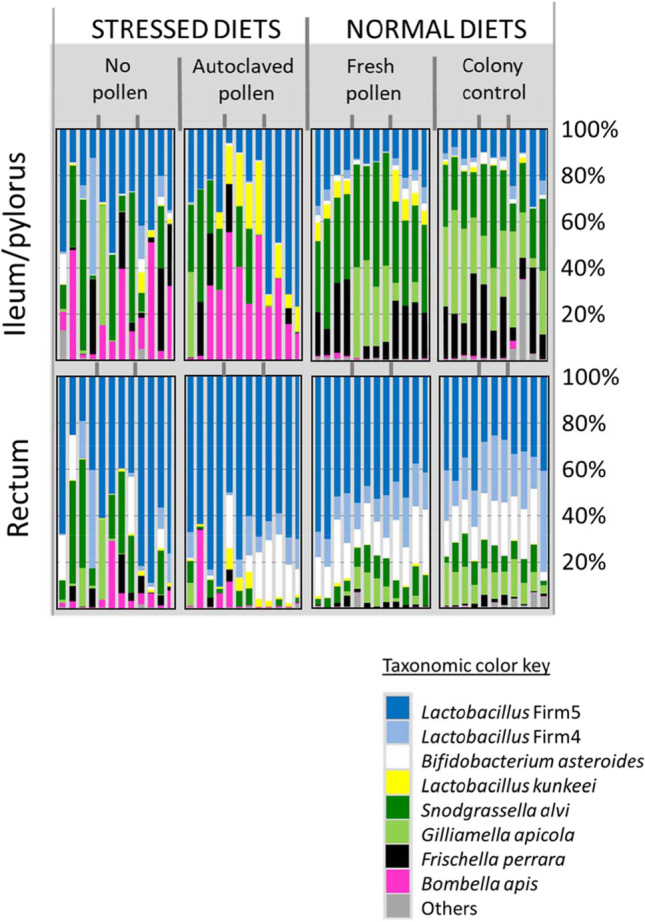
Fig. 5.

Bar charts representing the relative abundance of bacterial OTUs from two hindgut tissues and three treatment conditions plus a control, each composed of three replicate cages or colonies marked by grey dividers at the top and center of the diagram. Each bar is a single Illumina library, representing the combined tissues of three workers. We sequenced four libraries per replicate. The colony control is a natural colony environment. Diet treatments lack the colony context. The vertically oriented ileum and rectum microbiotas correspond to the same worker individuals. Note replicate variation
