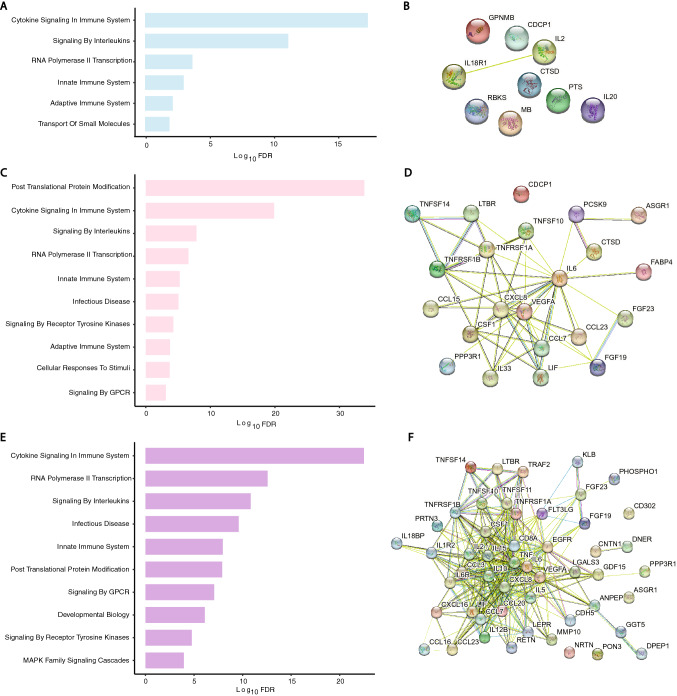
Figure 4.
Functional analysis of delirium-associated proteins in plasma of older patients by GSEA and PPI network analysis. (A) Bar-plots of REACTOME gene sets significantly enriched for delirium-associated proteins in preoperative plasma (6 gene sets; blue bars). (B) Constructed PPI network for the preoperative time point (9 nodes and 1 edge) was not significant (PPI enrichment = 0.38). (C) Bar-plots of REACTOME gene sets significantly enriched for delirium-associated proteins in postoperative plasma (12 gene sets; pink bars). (D) Constructed PPI network for the postoperative time point (22 nodes and 56 edges, PPI enrichment < 10−16). (E) Bar-plots of REACTOME gene sets significantly enriched in delirium-associated proteins for pre- to postoperative change (16 gene sets; purple bars). (F) Constructed PPI network for pre- to postoperative change (51 nodes and 317 edges, PPI enrichment < 10−16). Individual proteins in PPI networks are represented as nodes and interactions denoted by lines. For visual clarity, bar plots show a maximum of 10 of the most significantly enriched pathways.

