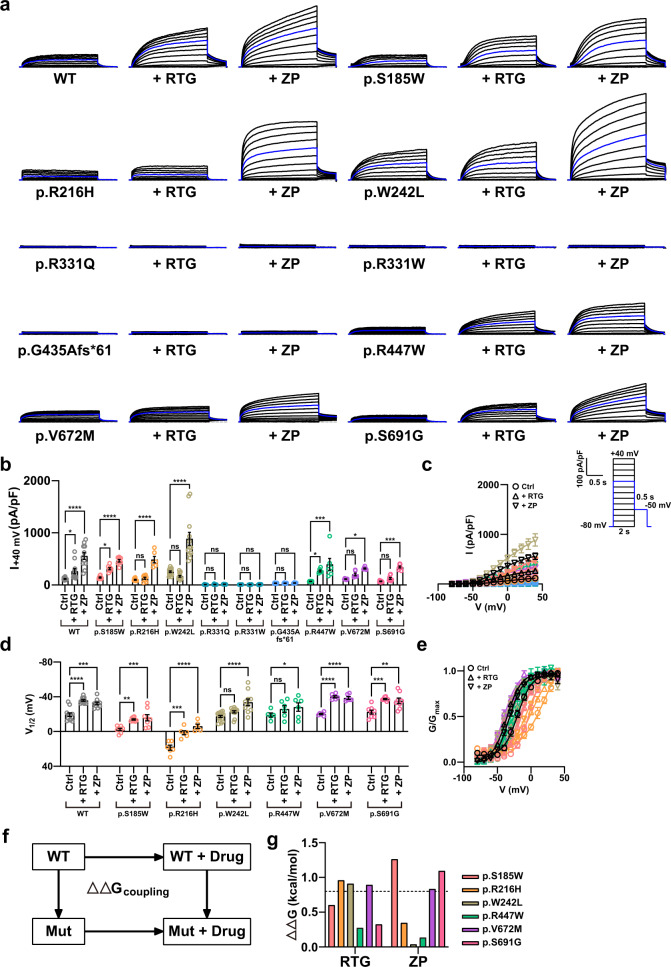
Fig. 4. Effect of retigabine and zinc pyrithione on the WT and mutant KCNQ4 currents.
a Whole-cell currents recorded from HEK 293 cells overexpressing WT or mutant KCNQ4. RTG and ZP represent retigabine and zinc pyrithione, respectively. Both drugs were administered at 10 μM. The blue line indicates the current measured at a 0 mV test pulse. b Current density measured at 40 mV. c Mean current-voltage (I-V) relationship. Trace representatives are the same as (b), except for the WT colored black. d Half-maximal voltages calculated by fitting the normalized conductance to the Boltzmann equation. The conductance was measured by calculating the magnitude of the tail currents at −50 mV after each voltage step. e Normalized conductance-voltage (G/Gmax-V) relationship. The curves were fitted using the Boltzmann equation. Trace representatives are the same as d, except for the WT colored in black. f Illustration of mutant-drug cycle analysis. was used to calculate the free energy deviation. g ΔΔGcoupling values for retigabine and zinc pyrithione with p.S185W, p.R216H, p.W242L, p.R447W, p.V672M, and p.S691G. The ΔΔGcoupling value of 0.8 kcal/mol was used as the cutoff for potential interactions. Values are shown as the mean ± SEM. P values were calculated using two-way ANOVA, followed by Tukey’s post hoc test; ns, not significant; p < 0.05, *p < 0.01, **p < 0.001, ***p < 0.0001, ****.

