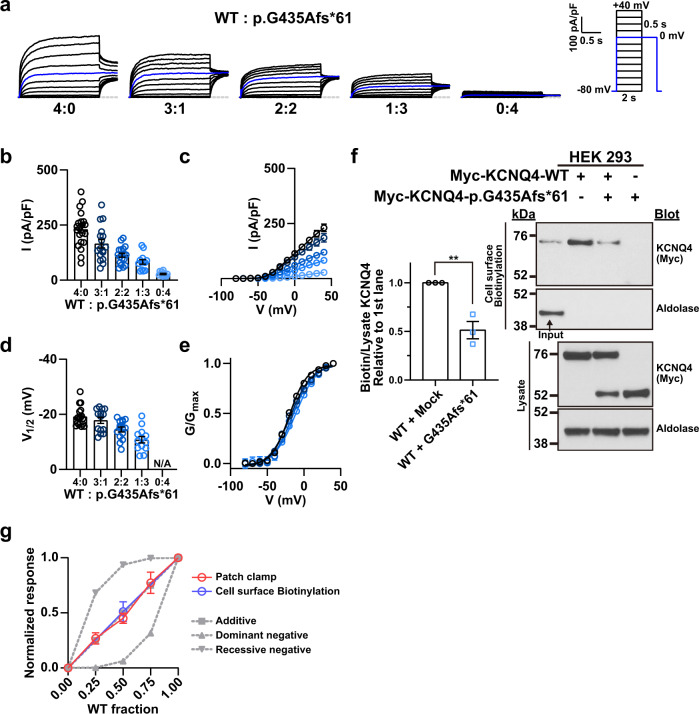
Fig. 6. Cotransfection of the p.G435Afs*61 variant with WT KCNQ4.
a Whole-cell currents recorded from HEK 293 cells overexpressing WT KCNQ4 with the p.G435Afs*61 variant proteins. From a holding potential of −80 mV, currents were evoked by depolarizing voltage steps from −80 to 40 mV in 10 mV increments. The blue line indicates the current measured at a 0 mV test pulse. b Current density measured at 40 mV. c Mean current-voltage (I-V) relationship. Trace representatives are the same as (b). d Half-maximal voltages calculated by fitting the normalized conductance to the Boltzmann equation. The conductance was measured by calculating the magnitude of the tail current at 0 mV after each voltage step. e Normalized conductance-voltage (G/Gmax-V) relationship. The curves were fitted using the Boltzmann equation. Trace representatives are the same as (d). f Immunoblotting with surface biotinylation assay of cotransfected WT and p.G435Afs*61 variant. g WT fraction-normalized response relationship. Additive, dominant-negative, and recessive negative traces are shown in gray; the patch clamp trace of p.G435Afs*61 with WT is shown in red; and the biotin trace is shown in blue. The normalized responses were calculated using (b and f). Values are shown as the mean ± SEM.

