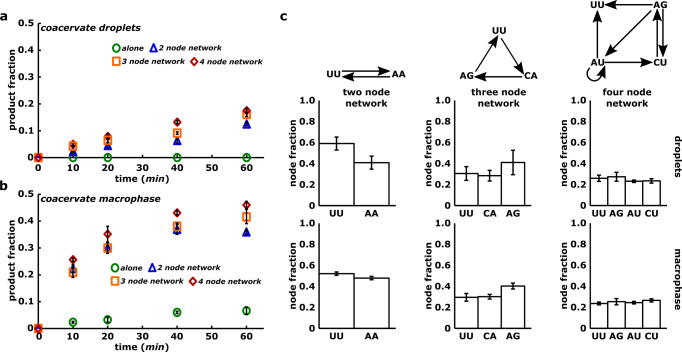
Fig. 3. Formation of cross-catalytic networks inside coacervates.
a Time courses showing the assembly of node UU as single node (alone, green circle), connected in a two nodes (blue triangle), three nodes (orange square) and four nodes network (red rhombus) in coacervate droplets. Network structures are shown in c (top). b Same as a but in the coacervate macrophase. All the time courses are measured in triplicates and mean WXYZ product formation is plotted along with standard deviation. c Bar-graphs showing the composition of two (left column), three (middle column), and four nodes network (right column). Network structures are shown at the top of each column. In these networks, arrow represents a directed edge showing the catalysis of a downstream node (WXYZ catalyst) by upstream node(s) (WXYZ catalyst) from its respective substrate fragments30,32,37. Here, compositions are represented as relative fraction of each network species (node) in the network and measured by quantifying the amount of each species formed in the network. All measurements were performed in triplicates and mean WXYZ product formation of each is plotted along with standard deviation.

