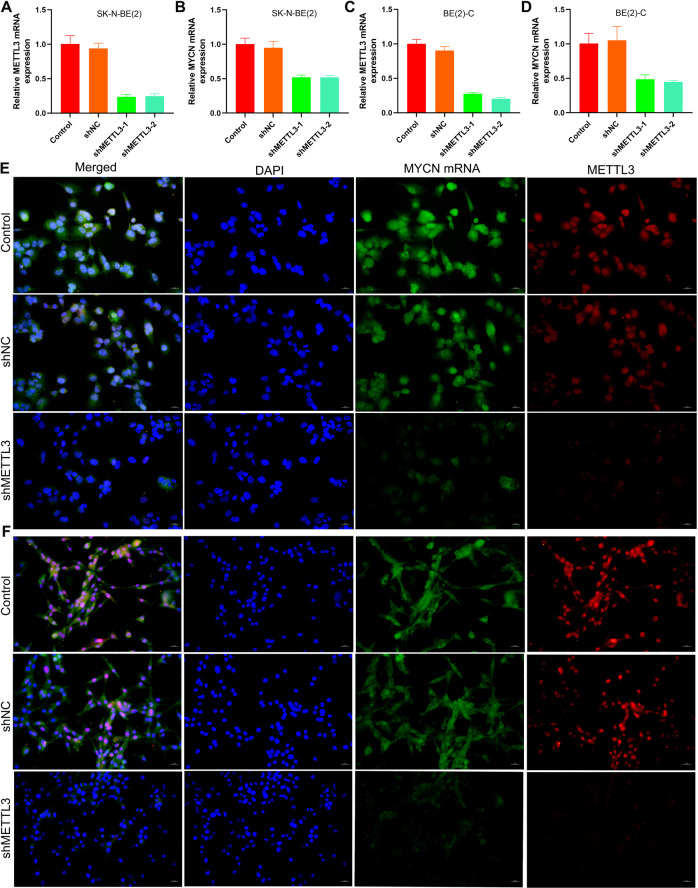
Fig. 5. Repression of m6A activation inhibited N-myc expression in MYCN-amplified NB cells.
A qRT-PCR analysis of the expression level of METTL3 mRNA in SK-N-BE(2) (n = 3); B qRT-PCR analysis of the expression level of MYCN mRNA in SK-N-BE(2) (n = 3); C qRT-PCR analysis of the expression level of METTL3 mRNA in BE(2)-C (n = 3); D qRT-PCR analysis of the expression level of MYCN mRNA in BE(2)-C (n = 3); E RNA-FISH and immunofluorescence analysis of the expression level of MYCN mRNA and METTL3 in SK-N-BE(2) (Green: MYCN mRNA; Red: METTL3 protein; Blue: DAPI); F RNA-FISH and immunofluorescence analysis of the expression level of MYCN mRNA and METTL3 in BE(2)-C (Green: MYCN mRNA; Red: METTL3 protein; Blue: DAPI).

