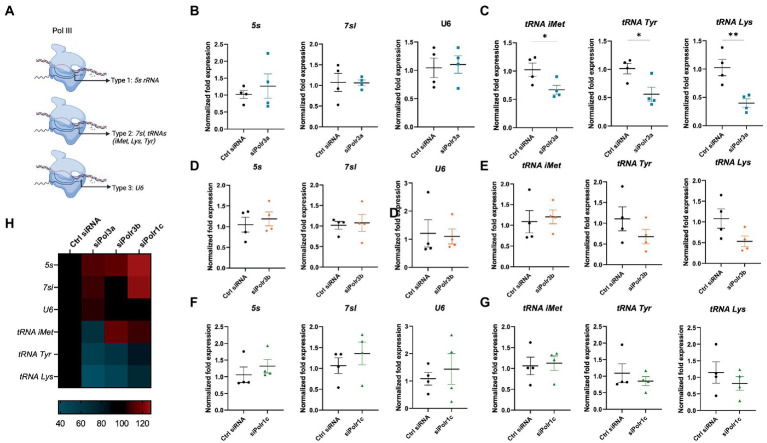
Figure 6.
Decreasing Pol III subunit expression in OL-lineage cells alters Pol III transcription. (A) Schematic of Pol III transcription, as grouped by its three promoter types. (B,C) RT-qPCR analysis of RNA derived from siPolr3a-treated OLs passaged into T3-containing differentiation media and collected at 3DIV, demonstrating expression of Pol III transcripts (B) 5 s, 7sl, and U6, and (C) tRNAs: tRNA-iMet (CAT 1-1), tRNA-Tyr (GTA 1-1), and tRNA-Lys (TTT 2-1). (D,E) RT-qPCR analysis of RNA derived from siPolr3b-treated OLs passaged into T3-containing differentiation media and collected at 3DIV, demonstrating expression of Pol III transcripts (D) 5 s, 7sl, and U6, and (E) tRNAs iMet (CAT 1-1), Tyr (GTA 1-1), and Lys (TTT 2-1). (F,G) RT-qPCR analysis of RNA derived from siPolr1c-treated OLs passaged into T3-containing differentiation media and collected at 3DIV, demonstrating expression of Pol III transcripts (F) 5 s, 7sl, and U6, and (G) tRNAs; tRNA-iMet (CAT 1-1), tRNA-Tyr (GTA 1-1), and tRNA-Lys (TTT 2-1). Data represents mean SEM normalized fold expression after normalizing to reference genes 18 s, Gusb, and Pgk1. *p < 0.05, **p < 0.01, ***p < 0.001, unpaired, two-sided Student’s t-test. (H) Heatmap representation of normalized fold expression, determined by RT-qPCR, grouped by OL-lineage marker (row), assessed across all siRNA-treatment conditions (column).

