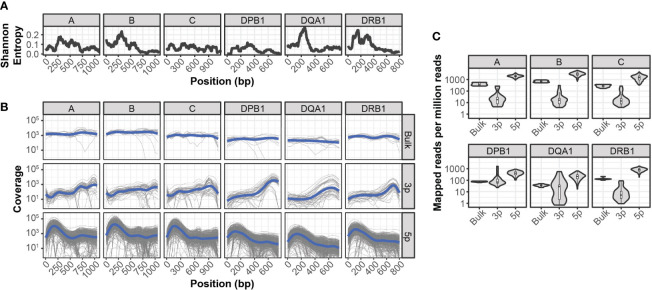
Figure 1.
Sequencing coverage of HLA allelic diversity (A) Rolling (100bp) mean Shannon entropy for published allele sequences of indicated HLA loci. (B) HLA coverage of reads mapped from bulk RNA-seq, 3’ (3p-based) scRNA-seq, and 5’ (5p)-based scRNA-seq. Grey lines represent individual samples, blue lines represent loess regression. (C) HLA-mapped reads per million total reads from bulk RNA-seq, 3’ (3p)-based scRNA-seq, and 5’ (5p)-based scRNA-seq.

