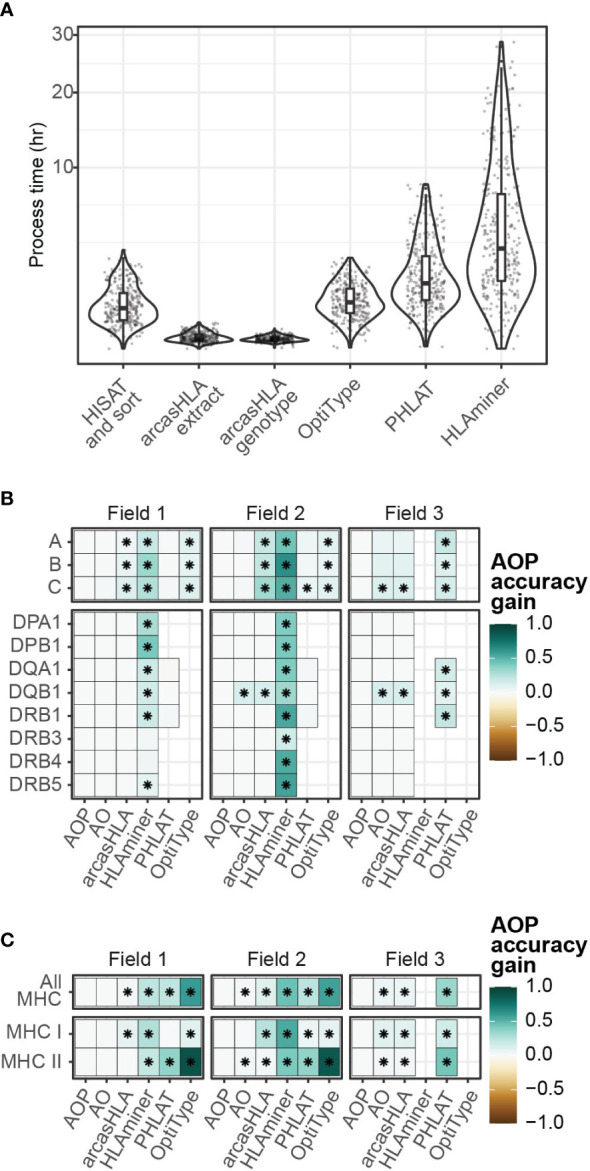
Figure 6.

Composite HLA prediction accuracy. (A) Runtime of major steps in genotyping pipeline. Y-axis distributed along square root scale. (B, C) Difference in mean accuracy between AOP composite and indicated alternative genotyping methods across (B) individual loci and (C) loci classes. (AOP) composite of arcasHLA, OptiType, PHLAT, (AO) composite of arcasHLA, OptiType. (*) FDR-adjusted p-value ≤ 0.05 by Wilcoxon rank sum test.
