Figure 7.
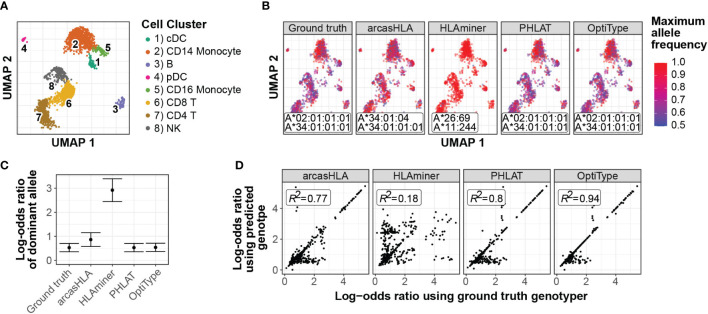
Effect of prediction accuracy on analysis of allele-specific HLA-A expression (A-C) Representative sample from 5’ data set. (A) UMAP projection of single-cell transcriptome data, annotated as previously described (4) (B) UMAP plots colored by cell-specific expression frequency of the most highly expressed HLA allele determined by scHLAcount. The reference genotype from each genotyper used by scHLAcount is annotated. (C) Summary log-odds ratios of dominant HLA-A allele from all cells in cDC cluster determined by random effects model. Error bars represent summary standard error. (D) Correlation of ground truth- and genotyper-derived HLA-A allele log-odds ratio from all samples and cell types.

