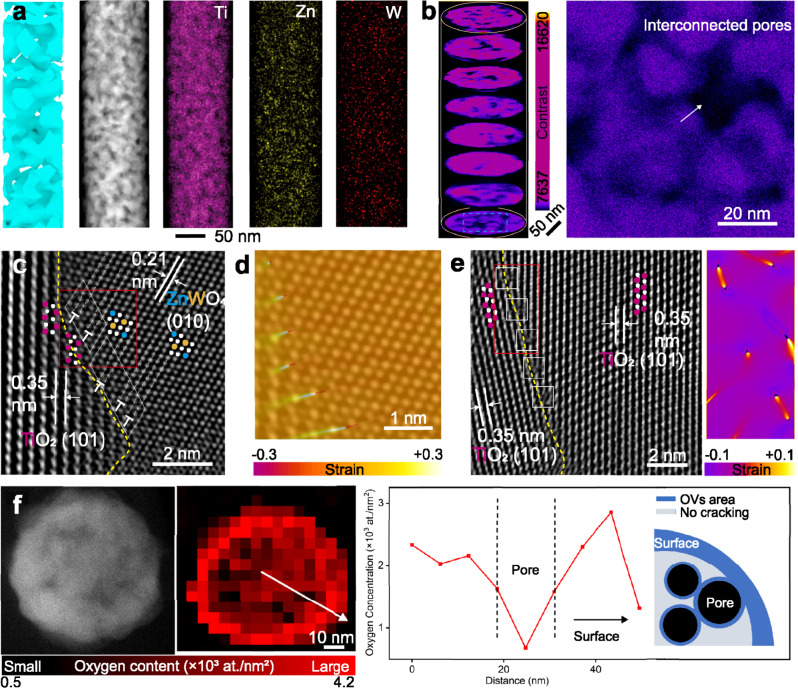
Fig. 2. Structural characterization of porous nanofibers.
a Structural illustration, STEM image and corresponding EDS elemental mappings of a nanofiber. b Three-dimensional reconstruction and TEM image of FIB slice showing the interconnected pores (highlighted by the arrow) inside a nanofiber. The area of amplification in (b) is marked with a blue dashed box. The color bar in (b) represents the contrast. HRTEM images (c, e) and corresponding GPA strain analysis (d, e) of grain boundaries within a nanofiber. In (c) and (e), strain analysis area is marked with red boxes; Ti, O, Zn and W atoms are highlighted by magenta red, white, blue and orange dots, respectively; dislocation areas are marked with white boxes; grain boundaries are highlighted by yellow dashed lines; lattice spacing is highlighted by white lines in pairs. The color bars in (d) and (e) represent the strain. f STEM image and corresponding EELS mapping of oxygen atoms on the FIB slice of nanofiber (left), and the analysis results of oxygen content distribution on a nanofiber slice (right). The color bar in (f) represents the oxygen content (×103 at./nm2) on slice.

