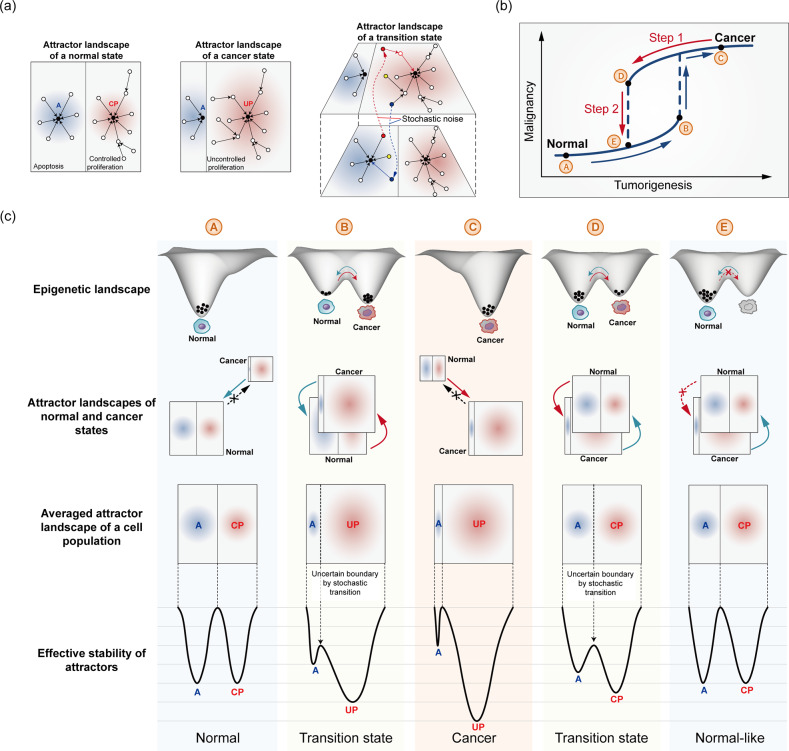
Fig. 4. Attractor landscapes of normal and cancer cells during tumorigenesis and cancer reversion.
a Attractor landscapes of normal, cancer, and transition states. Circles represent network states of a cell. In a transition state, a network state of an attractor landscape can jump to the same network state in an adjacent landscape because of stochastic noise; therefore, the network state can converge to a completely different attractor state. Attractor states: A apoptosis, CP controlled proliferation, UC uncontrolled proliferation. b Distinct forward and backward paths along the transition trajectories from the normal to the cancer states and the reversion trajectories from the cancer to the normal states. c Epigenetic landscapes, attractor landscapes, and effective stability of the attractors during tumorigenesis and cancer reversion. Points A to E correspond to positions along the graph shown in (b). Each valley in the epigenetic landscape represents a cell state, either a normal or cancer state, where cells designated as black dots can either maintain a stable state or stochastically transition between stable states during a transition. The average attractor landscape of a cell population in each condition can be obtained through the linear combination of normal and cancer attractor landscapes, where a solid line between the A and CP or UP attractor states indicates a high barrier between states and a dashed line indicates a barrier low enough for cells to move between attractor states.

