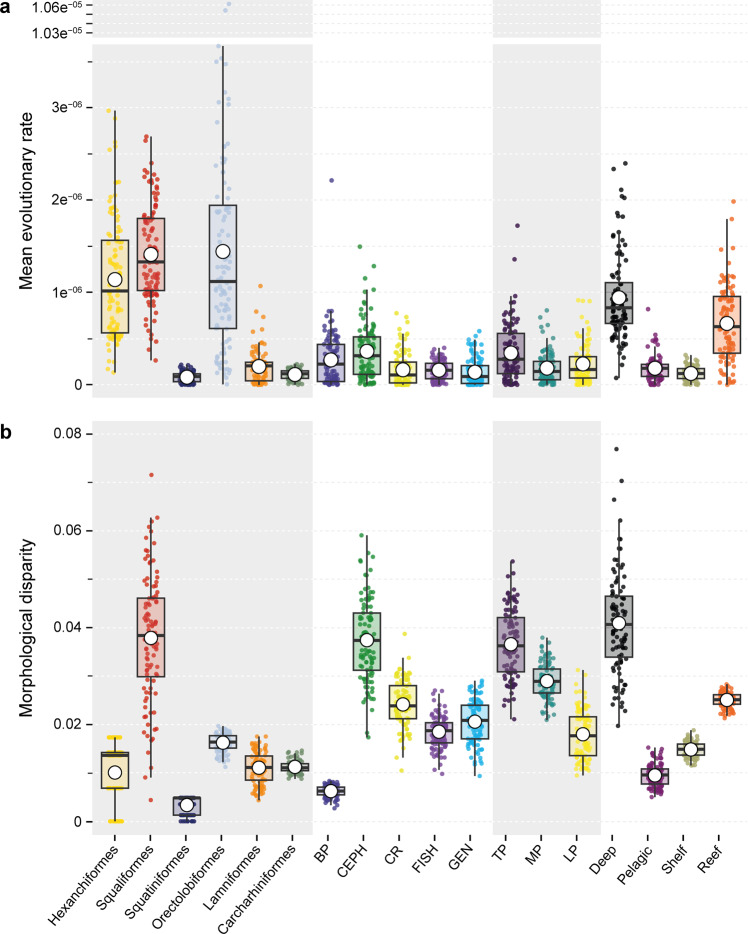
Fig. 3. Mean evolutionary rates and the morphological disparity between orders, diet guilds, trophic level, and habitat.
a Evolutionary rate for each group (σ) estimated from the stochastic mapping of each categorical variable over 100 simulations. b Morphological disparity as Procrustes variance, comparison between the groups. A large white dot in the middle of the boxes shows the mean, while the lines inside the box show the median. Abbreviations as in Fig. 2.

