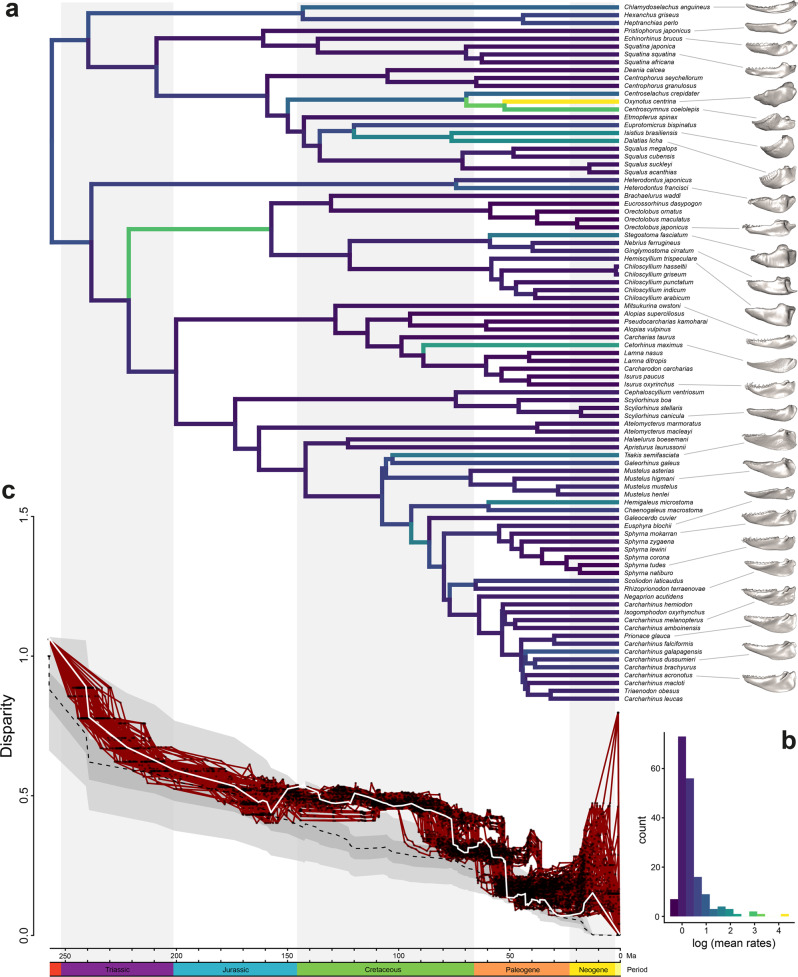
Fig. 5. Evolutionary rates of jaw shape among modern sharks.
Shifts in jaw shape evolution by branch based on the variable rates model in BayesTraits (a) branches on the phylogeny indicate faster rates (warmer colours) and lower rates (colder colours) (b). Disparity through time plot for jaw shape (c). Solid white line: observed subclade disparity for the maximum credibility tree; dashed line: Brownian motion expectation; shaded area: 95% confidence interval of Brownian motion simulations. Solid red lines: observed subclade disparity for each tree from the random subsample (100 trees) and the relative node position indicated by the black dots. Representative jaws reconstructions for each order are indicated by a dashed line.

