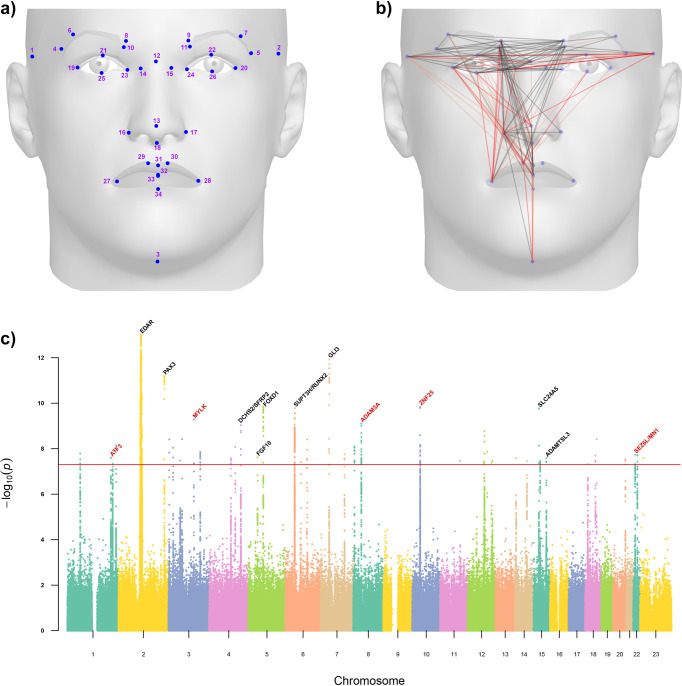
Fig. 1. Overview of the facial features GWAS performed here.
a Dots indicate the location of the 34 facial landmarks used for calculation of 301 inter-landmark distances (ILDs, Supplementary Table 2 provides additional information on these landmarks). b Lines represent the 148 ILDs for which we detected significant association with at least one genomic region in the CANDELA data. Black lines refer to ILDs that resulted in replication of previously reported associations (Table 1). Red lines represent ILDs that revealed novel associations (with a darker red highlighting the ILDs associated with five genomic regions discussed in the text; Table 2). c Combined Manhattan plot illustrating all significant GWAS hits (-log(P) > 7.3, red line). Black labels indicate candidate genes from previous GWASs that were replicated here (Table 1). Red labels highlight the main candidate genes at the five novel regions discussed in the text. For visibility, the y-axis has been truncated at a -log(P) of 13.

