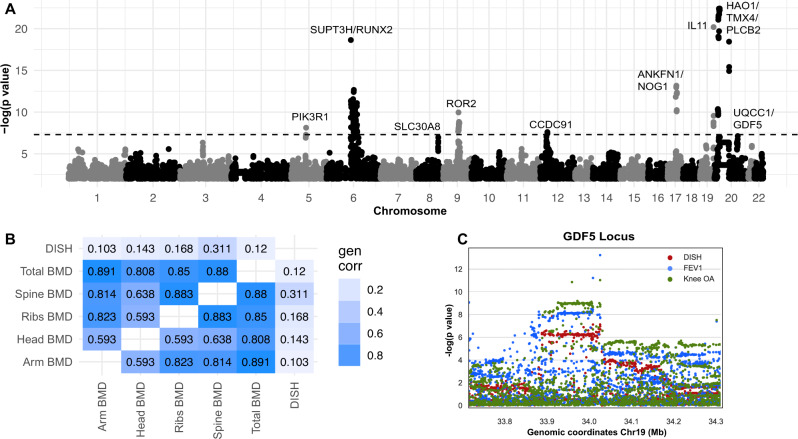
Fig. 4. Genetic associations and genetic correlation.
A Manhattan Plot of DISH GWAS. Associations reaching genome-wide significance below p value < 5e−8 were labeled. The p value is the two-tailed test for association of trait with variant. B Genetic correlation between DISH and other phenotypes derived from DXA scans, estimated using LD score regression from UK Biobank summary statistics. C GDF5 locus showing a clear overlap of genome-wide significant signals with DISH, Osteoarthritis (OA), and lung Forced Expiratory Volume in one second (FEV1). The p value is the two-tailed test for association of trait with variant.

