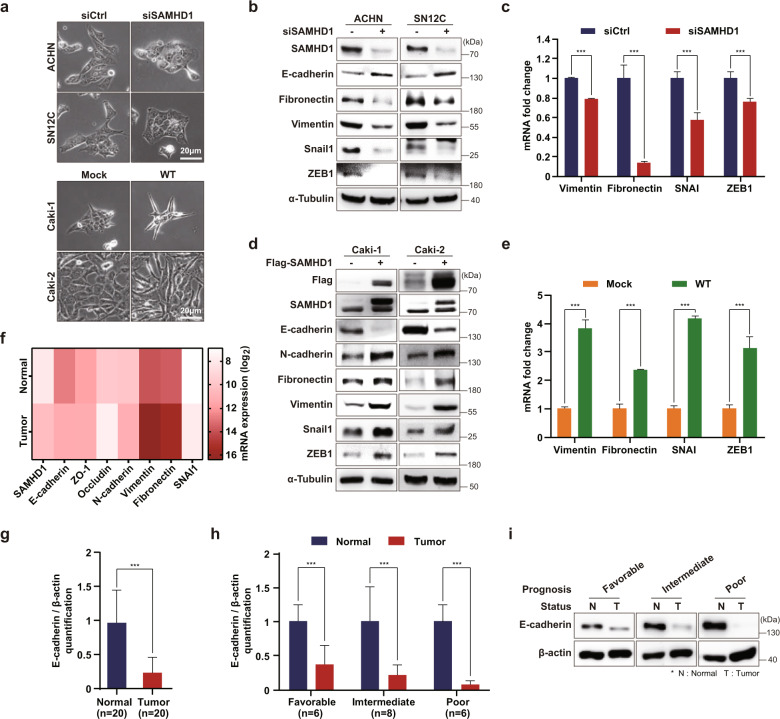
Fig. 3. SAMHD1 enhances epithelial–mesenchymal transition.
a Phase-contrast microscopy revealed changes in cell morphology from epithelial to mesenchymal characteristics in different ccRCC cells after SAMHD1 knockdown or overexpression. Scale bar, 20 μm. b Western blot analysis of epithelial and mesenchymal gene expression after SAMHD1 knockdown in ACHN and SN12C cells. c qPCR analysis of mesenchymal markers after SAMHD1 knockdown in SN12C cells. Data are presented as the mean ± SD. The experiments were independently performed at least three times. ***p < 0.001. d Western blot analysis of epithelial and mesenchymal markers in SAMHD1-overexpressing Caki-1 and Caki-2 cells. e qPCR analysis of mesenchymal markers in SAMHD1-overexpressed Caki-1 cells. Data are presented as the mean ± SD. The data shown are representative of three independent experiments. ***p < 0.001. f Association between the expression of SAMHD1 and that of epithelial or mesenchymal markers based on ccRCC clinical data. g E-cadherin protein levels relative to β-actin levels for 20 paired tumor and normal tissues. Data are presented as the mean ± SD. ***p < 0.001. h E-cadherin protein levels relative to β-actin levels in tissues of patients with ccRCC according to prognosis. Data are presented as the mean ± SD. **p < 0.01; ***p < 0.001. i Western blot analysis of E-cadherin expression in 20 paired tissue samples from patients with ccRCC. Western blot bands are presented with the corresponding prognosis. Data are presented as the mean ± SD.

