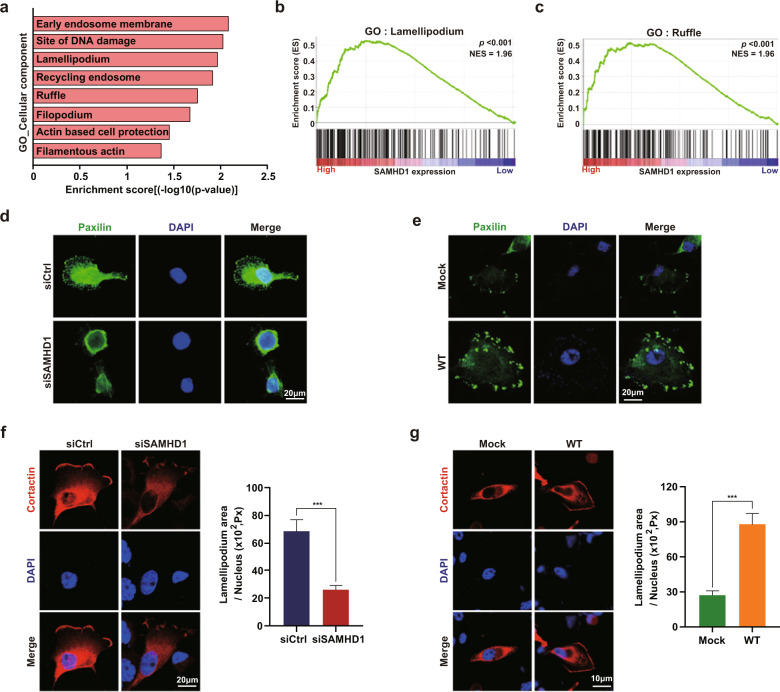
Fig. 4. SAMHD1 is positively correlated with dynamic cytoskeletal changes in lamellipodia formation.
a Gene Ontology (GO) analysis of the cellular component subcategories positively regulated by SAMHD1 overexpression. b, c Gene set enrichment analysis (GSEA) related to cytoskeletal changes for cell migration in the SAMHD1 high expression group. ***p < 0.001. d, e Immunofluorescence (IF) with anti-paxillin antibodies and 4′,6-diamidino-2-phenylindole (DAPI) staining of SAMHD1 knockdown SN12C cells or SAMHD1 overexpressed Caki-1 cells. Scale bar, 20 μm. f mCherry-cortactin was transfected as a control, and SAMHD1 was knocked down in SN12C cells for lamellipodium observation (left). Scale bar, 20 μm. Graphs present the lamellipodium area in each cell (right) (n = 20 cells). Data are presented as the mean ± SEM. ***p < 0.001. g SAMHD1-overexpressing Caki-1 cells and control cells were transfected with mCherry-cortactin for lamellipodium observation (left). Scale bar, 10 μm. Graphs present the lamellipodium area in each cell (right) (n = 20 cells). Data are presented as the mean ± SEM. ***p < 0.001.

