FIGURE 2.

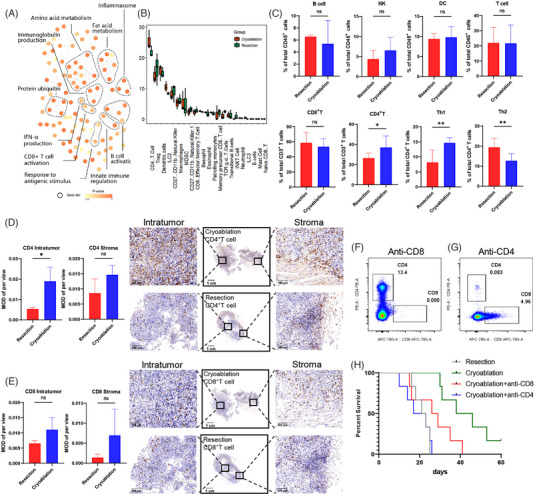
Cryoablation modulated the tumour immune microenvironment. (A) Network of molecular pathways of RNA‐sequencing experiments conducted on TILs isolated from mice after cryoablation or resection. (B) Immuno‐infiltration analysis of the transcriptome using CIBERSORT. Orange represents the cryoablation group and green represents the resection group. (C) Flow cytometric analysis of lymphocyte subpopulations isolated from secondary tumours in the cryoablation and the resection groups. Data are represented as the mean ± SD. **p < .01, *p < .05, cryoablation vs. resection. (D, E) Immunohistochemical staining of CD4+ and CD8+ T cells in the secondary tumours in cryoablation and resection groups to compare the total number of T cells and infiltrated T cells inside or at the margin of the tumours. Data are represented as the mean ± SD. *p < .05, cryoablation vs. resection. Scale bars, 1 cm (1×), 100 µm (20×). (F) Flow cytometry validating the depletion efficacy of CD8+ T cells in a murine model. (G) Flow cytometry validating the depletion efficacy of CD4+ T cells in a murine model. (H) Kaplan–Meier curves showing the overall survival of rechallenged mice after different treatments for primary tumours: surgical resection, cryoablation, cryoablation plus depletion of CD4+ T cells, and cryoablation plus depletion of CD8+ T cells.
