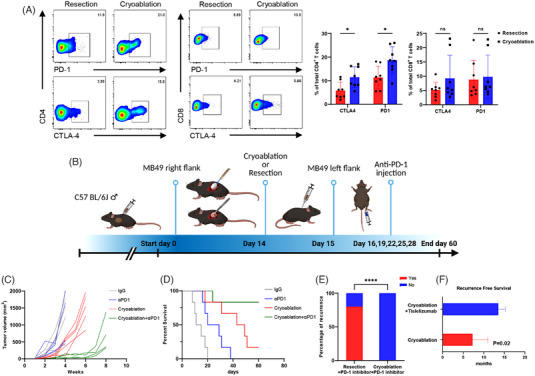
FIGURE 6.

Cryoablation and PD‐1 inhibitors exerted synergistic antitumour effects. (A) Flow cytometric analysis of PD‐1 and CTLA‐4 expression in CD4+ and CD8+ T cells of secondary tumours after cryoablation (n = 8) or surgical resection (n = 8). Data are represented as the mean ± SD, *p < .05, cryoablation vs. resection. (B) Schematic diagram of the evaluation of the combination therapy. (C) Volume growth curve of secondary tumours in each group (IgG, αPD1 only, cryoablation only and cryoablation+αPD1). n = 5 mice per group. Observed every week until death or until the tumour volume reached 2000 mm3. (D) Kaplan–Meier curves illustrating the survival of mice after rechallenge (n = 6 per group). (E) Occurrence of secondary tumours using 5 × 105 MB49 cells 30 days after the combination therapy of cryoablation/resection and αPD‐1. ****p < .0001, cryoablation+PD‐1 inhibitor vs. resection+ PD‐1 inhibitor. (F) Recurrence‐free survival of patients with bladder cancer treated with cryoablation alone and cryoablation in combination with tislelizumab. p = .02, cryoablation + tislelizumab vs. cryoablation.
