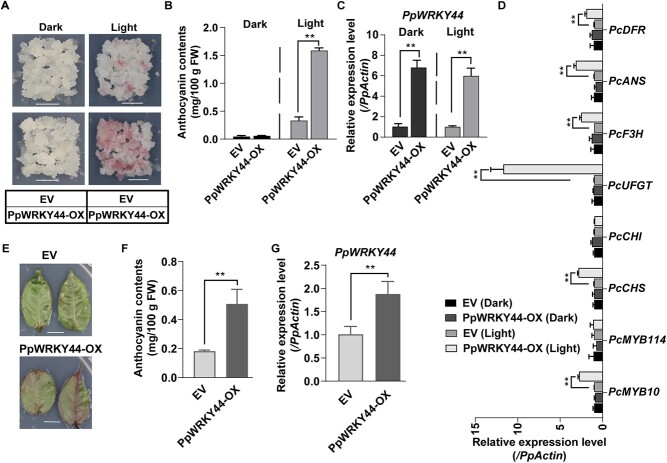
Figure 3.
PpWRKY44 functional assay through its overexpression in pear calli and pear leaves. (A) Phenotypes of EV and PpWRKY44-OX calli after a 6-day light treatment. Scale bars = 1 cm. (B) Content of anthocyanin in EV and PpWRKY44-OX calli. (C) PpWRKY44 expression level in EV and PpWRKY44-OX calli. (D) Relative transcript levels of PcMYB10, PcMYB114, PcCHS, PcCHI, PcDFR, PpF3H, and PpANS in EV and PpWRKY44-OX calli. (E) Phenotypes of leaves transiently transformed with PpWRKY44-OX or EV and (F) their anthocyanin contents after 3-day light treatment. (G) PpWRKY44 expression level in transgenic pear leaves. Error bars represent the standard deviation of three biological replicates. The expression level of EV was used as the reference. **P < .01 (two-tailed Student’s t-test).

