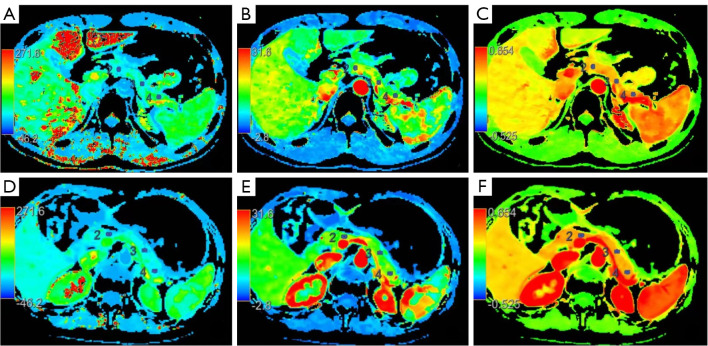
Figure 2.
Representative pancreas images from the continuous perfusion scan (A-C) and intermittent perfusion scan (D-F). (A) PS values of the pancreatic neck, body, and tail were 32.00 (mL/100 g/min), 41.11 (mL/100 g/min), and 35.75 (mL/100 g/min), respectively. (B) BV values of the pancreatic neck, body, and tail were 16.72 (mL/100 g), 16.55 (mL/100 g), and 16.89 (mL/100 g), respectively. (C) PEI values of the pancreatic neck, body, and tail were 0.299, 0.302, and 0.310, respectively. (D) PS values of the pancreatic neck, body, and tail were 23.32 (mL/100 g/min), 23.78 (mL/100 g/min), and 24.80 (mL/100 g/min), respectively. (E) BV values of the pancreatic neck, body, and tail were 17.27 (mL/100 g), 18.12 (mL/100 g), and 17.89 (mL/100 g), respectively. (F) PEI values of the pancreatic neck, body, and tail were 0.370, 0.332 and 0.350, respectively. PS, permeability surface; BV, blood volume; PEI, positive enhanced integral.

