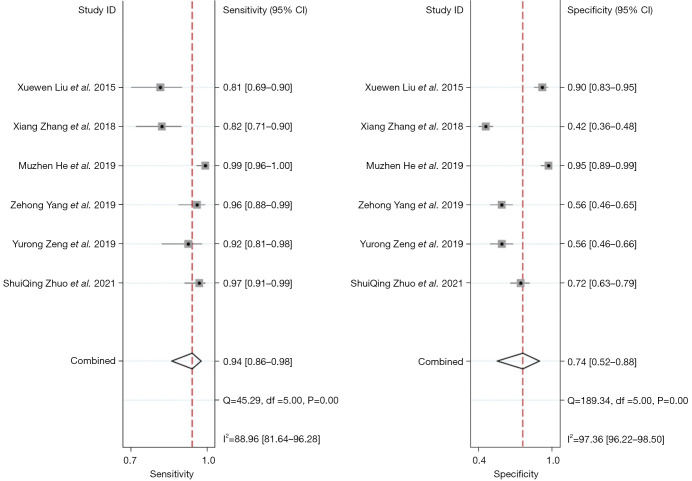
Figure 3.
Forest plots of primary study sensitivity (left) and specificity (right) of the NIC in the arterial phase combined with the slope in the arterial phase for detecting metastatic lymph nodes. Each solid square represents an individual study. Error bars represent 95% CIs. Diamonds indicate the pooled sensitivity and specificity for all of the studies. NIC, normalized iodine concentration; CI, confidence interval.

