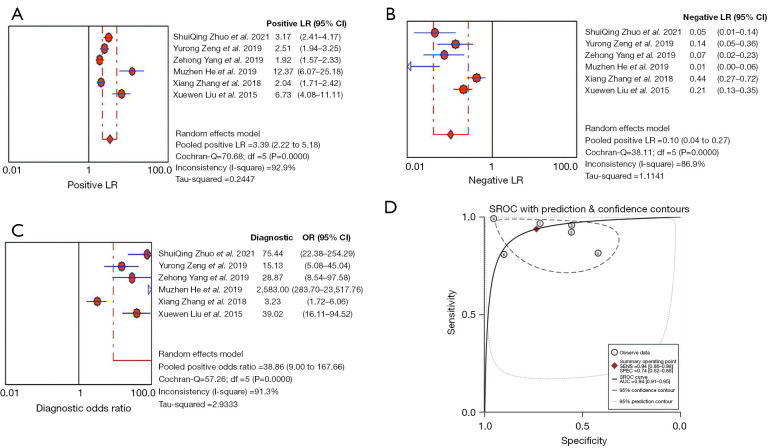
Figure 4.
Forest plots of PLR (A), NLR (B), DOR (C), and AUC of SROC (D) for the NIC in the arterial phase combined with the slope in the arterial phase. (A) The combined PLR of NIC in the arterial phase combined with the slope in arterial phase for detecting metastatic lymph nodes was 3.39 (95% CI: 2.22–5.18). (B) The combined NLR of the NIC in the arterial phase combined with the slope in the arterial phase for detecting metastatic lymph nodes was 0.10 (95% CI: 0.04–0.27). (C) The combined DOR of NIC in the arterial phase combined with the slope in the arterial phase for detecting metastatic lymph nodes was 38.86 (95% CI: 9.00–167.66). (D) The AUC of the NIC in the arterial phase combined with the slope in the arterial phase was the largest, with a value of 0.94. LR, likelihood ratio; CI, confidence interval; PLR, positive likelihood ratio; NLR, negative likelihood ratio; DOR, diagnostic odds ratio; AUC, area under curve; SROC, summary receiver operating characteristic; NIC, normalized iodine concentration; SENS, sensitivity; SPEC, specificity.

