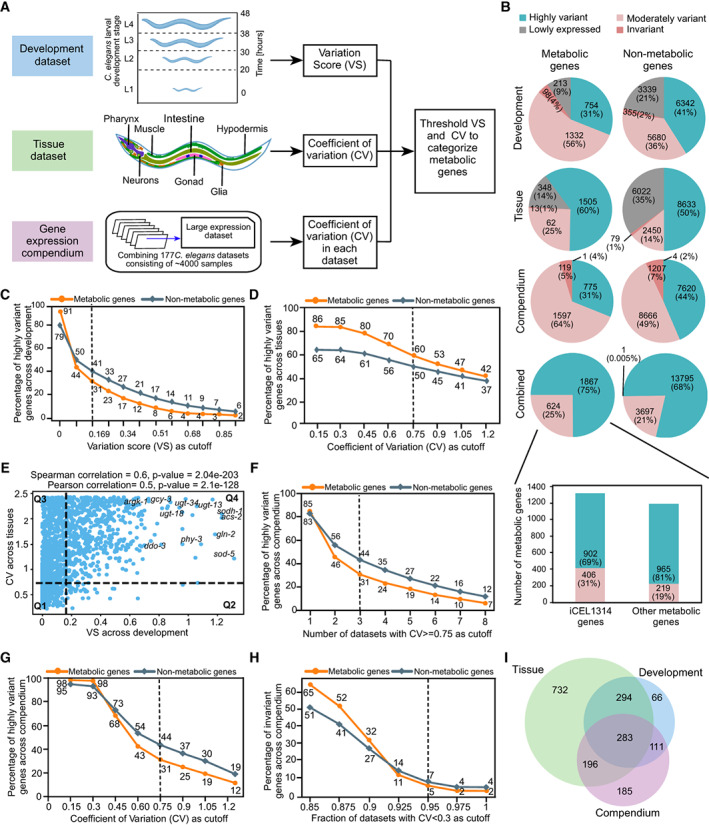
Computational pipeline to identify C. elegans metabolic genes that change in expression during development, across tissues, and compendium of multiple conditions. Statistically significant differences in gene expression were calculated in the developmental dataset using a variation score (VS), in the tissue dataset using coefficient of variation (CV) and by number of datasets with CV ≥ 0.75 in the compendium (collection of 177 datasets).
Pie charts of metabolic and nonmetabolic gene expression variation in the three different datasets: development, tissue, and compendium separately and combined. Bar graph shows metabolic genes in iCEL1314 and other (predicted) metabolic genes.
Comparison of percentage of highly variant metabolic versus nonmetabolic genes at different VS thresholds.
Comparison of percentage of highly variant metabolic versus nonmetabolic genes at different CV thresholds.
Scatter plot of VS (development) versus CV (tissue) of metabolic genes. The plot is divided into four quadrants: Q1 with moderate/low VS and moderate/low CV; Q2 with high VS and moderate/low CV; Q3 with moderate/ low VS and high CV; and Q4 with high VS and high CV. The Pearson and Spearman correlation coefficients and the corresponding P‐values are indicated. Examples of Q4 genes that are highly variant both during development and in different tissues include ugt‐13, ugt‐18, and ugt‐34 (UGT enzymes); gcy‐3 (guanylate cyclases); and ddo‐3, gln‐2, argk‐1, and phy‐3 (amino acid metabolism).
Comparison of percentage of highly variant metabolic versus nonmetabolic genes at different cutoffs of number of datasets with high CV (≥ 0.75).
Comparison of percentage of highly variant metabolic versus nonmetabolic genes at different CV cutoffs in at least three datasets in the compendium.
Comparison of percentage of invariant metabolic versus nonmetabolic genes at different cutoffs of the fraction of datasets with low CV (< 0.3).
Venn diagram of highly variant metabolic genes in the different datasets.

